GBP/USD also tried to resume its downward movement on Tuesday, but it wasn't quite successful. We want to point out that the euro and the pound, which usually correlate well with each other, have been moving quite differently over the past month or even year. Therefore, one cannot expect the British pound to fall just because the euro is falling. The pound has been rising for two months, and while the euro has started moving downwards, the British currency seems to be merely hinting at a potential decline.
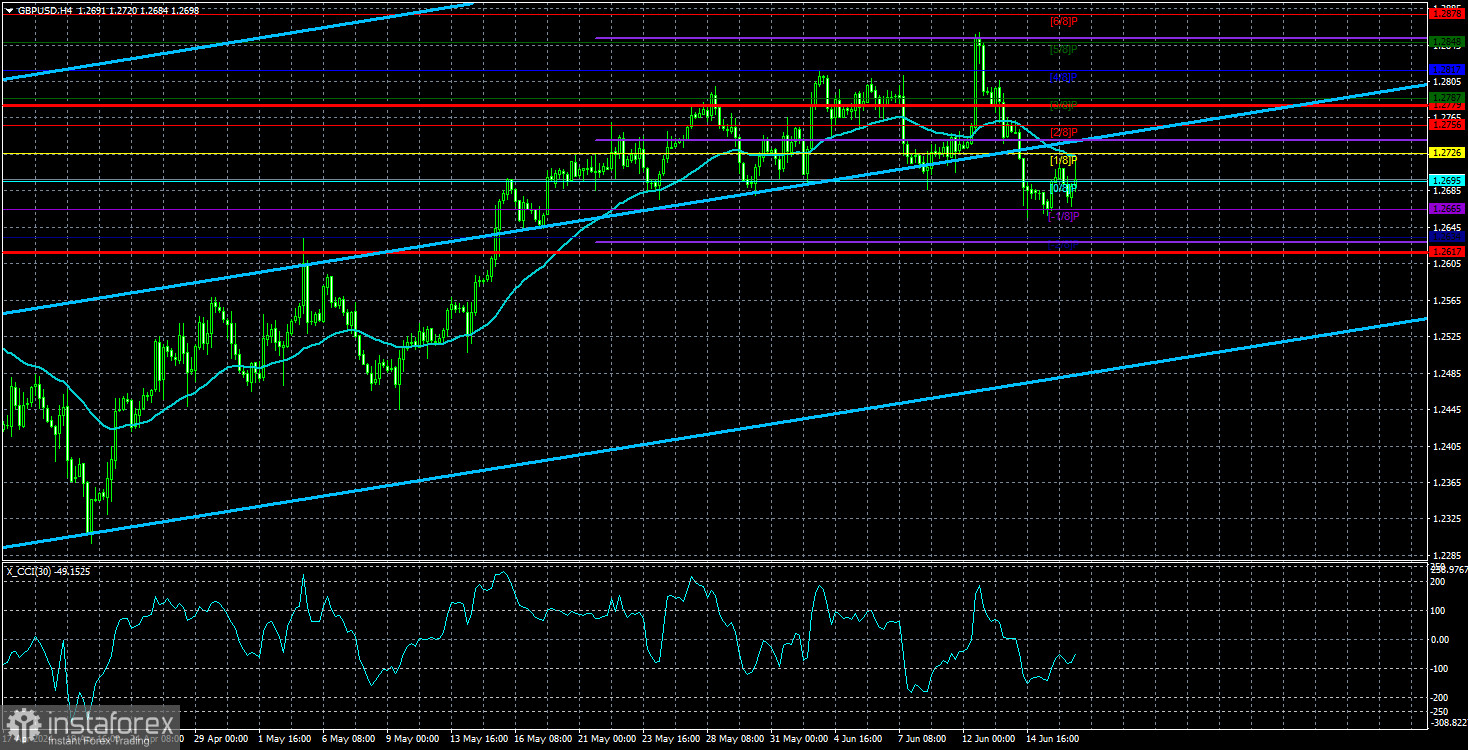
The technical picture for the pound remains complex and confusing. On the 4-hour timeframe, the pair breached the important Murray level "0/8" at 1.2695, but the price did not fall further. More time might be needed to realize this scenario, but today, the UK inflation report will be released, and this could easily trigger a new rise in the British currency.
Take note that the market continues to favor the pound and detest the dollar. The last two U.S. inflation reports, which showed a minor slowdown of 0.1%, almost caused the dollar to collapse. Meanwhile, when British inflation fell by almost 1% in April, the pound managed to strengthen. The market refuses to pay attention to the nature of the news and its broader implications. Every trader understands that a decline in inflation to near-target levels means that the Bank of England could start easing monetary policy right now. Similarly, every trader understands that if U.S. inflation eases from 3.4% to 3.3%, this doesn't actually bring the Federal Reserve any closer to its first rate cut.
Nevertheless, the market reacts to British inflation as if a drop to 2.3% means nothing, while they respond to U.S. inflation as if a 0.1% slowdown can push the Fed to finally start its monetary easing cycle. Thus, today's market reaction is entirely unpredictable. If anyone thinks that a decrease in UK inflation to 2% or below can exert significant pressure on the pound, we highly doubt it. Yes, according to classic fundamental analysis, that's what should happen. But how many similar situations have there been in the past six months where the pound should have fallen but it didn't?
At the same time, this cannot go on indefinitely. It is clear that the pound maintains its current position with the help of large players who ignore routine economic reports, and this particular group of people have the ability to disregard major fundamental events. This looks like a "Stop Loss hunt" against small traders expecting a decline. However, sooner or later, market makers will also start selling the pair. It is impossible to predict when this will happen unless you are one of the market makers.
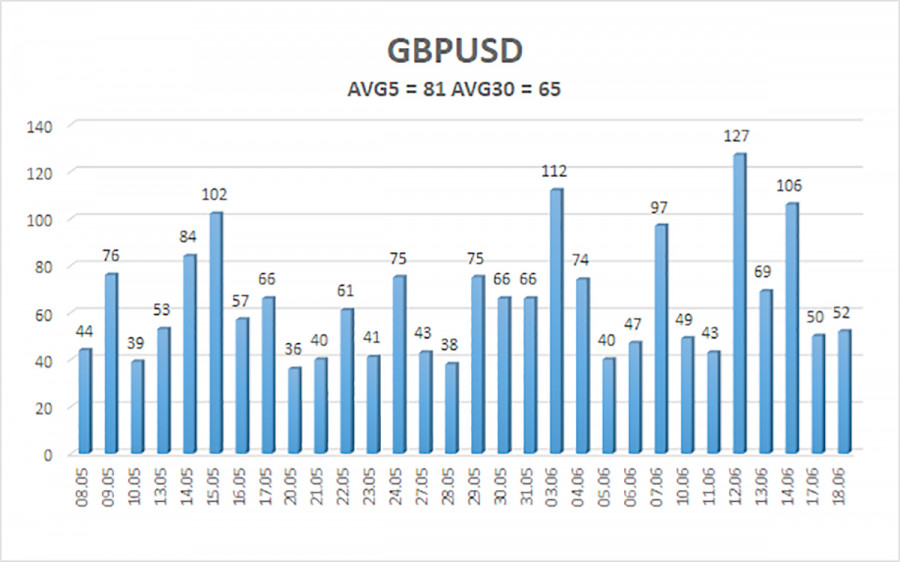
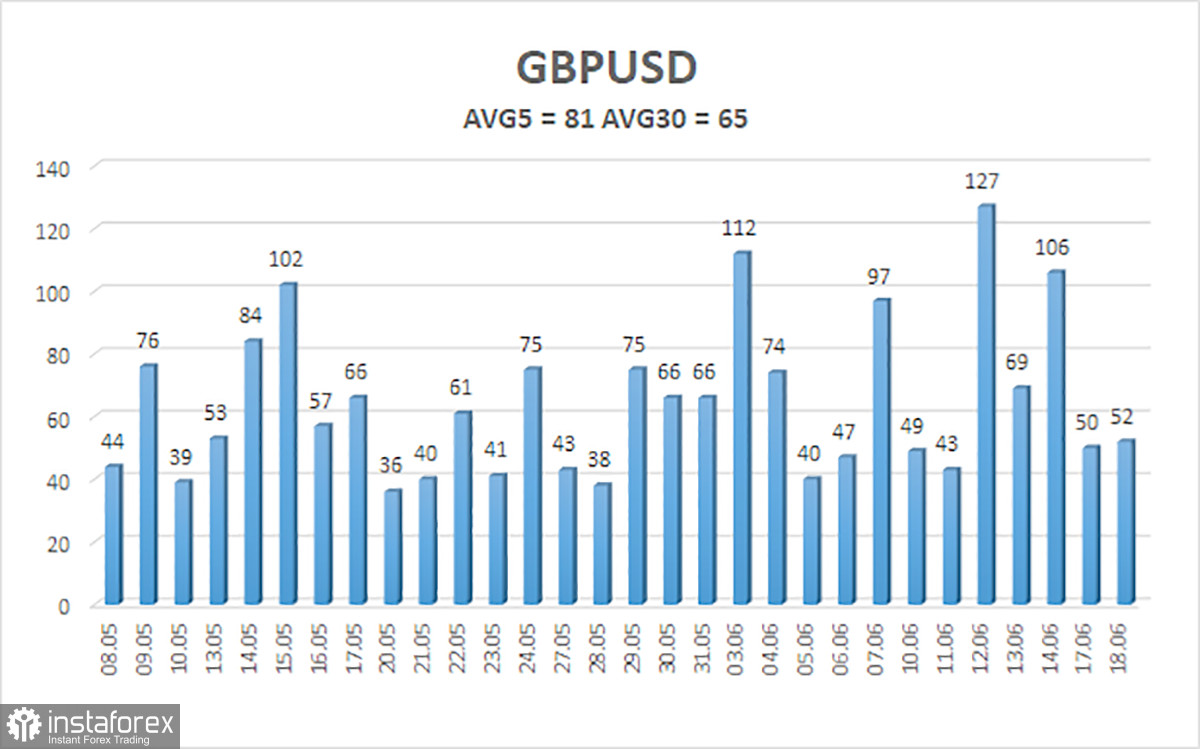
The average volatility of GBP/USD over the last five trading days is 81 pips. This is considered an average value for the pair. Today, we expect GBP/USD to move within a range bounded by the levels of 1.2617 and 1.2779. The higher linear regression channel is pointing upwards, which suggests that the upward trend will continue. The CCI indicator entered the oversold area three times in the month before last, and the British currency started a new phase of growth. However, this correction should have ended a long time ago.
Nearest support levels:
S1 - 1.2695
S2 - 1.2665
S3 - 1.2634
Nearest resistance levels:
R1 - 1.2726
R2 - 1.2756
R3 - 1.2787
Trading Recommendations:
The GBP/USD pair consolidated above the moving average line and once again it is trying to break the upward trend that we've seen in recent months. Therefore, after consolidating below the moving average line and breaking through the area of 1.2680-1.2695, the pound has a good chance of falling further. However, traders should exercise caution with any positions in the British currency. There is still no reason to buy it, and selling it is also dangerous because the market ignored the fundamental and macroeconomic background for two months. Traders often refuse to sell GBP/USD. Anything can happen this week.
Explanation of Illustrations:
- Linear Regression Channels – Helps determine the current trend. If both are directed in the same direction, it means the trend is currently strong.
- Moving Average Line (settings 20.0, smoothed) – Determines the short-term trend and the direction in which trading should currently be conducted.
- Murray Levels – Target levels for movements and corrections.
- Volatility Levels (red lines) – The probable price channel in which the pair will spend the next day, based on current volatility indicators.
- CCI Indicator – Its entry into the oversold area (below -250) or the overbought area (above +250) means that a trend reversal in the opposite direction is imminent.