Analysis of GBP/USD 5M
GBP/USD came under selling pressure on Wednesday, which was not triggered by the macroeconomic or fundamental background. The fact that the pound fell without any strong reasons or basis is encouraging enough. We have long expected a significant drop, but the market had been pushing for a correction for a long time as it hoped that the Federal Reserve will deliver its interest rate cut sooner. This has yet to happen, so now the GBP/USD pair finds itself in a situation where there are no reasons to buy the pound, but starting to sell it would mean the market admits its own mistake.
However, we remain bearish, as we believe that the pound doesn't have any reason to rise further. The global downtrend remains intact. The pound is overbought and overly expensive, and it has a huge potential to fall. It's a good thing that the pair has started to fall. We should mention that we are not dollar fans. We simply support logical and predictable movements that can be traded profitably. Therefore, at this time, we still expect a prolonged and strong decline.
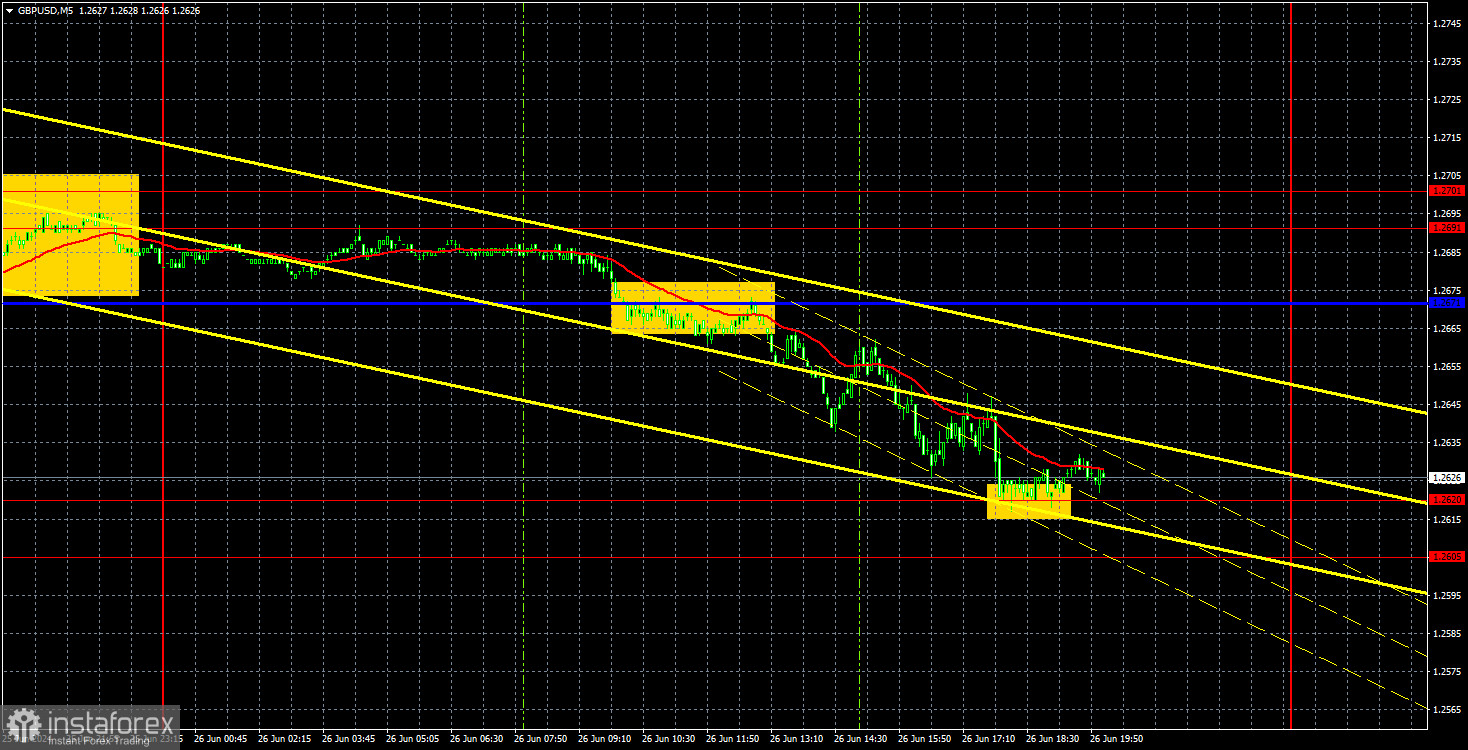
The pair formed one trading signal on Wednesday. The price overcame the Kijun-sen line, after which it managed to drop to the nearest target level of 1.2620. The price bounced off this level, so traders could open long positions. However, the pound is currently around this mark, so no profit or loss has been realized on this trade yet. The first trade yielded a profit of about 35-40 pips, which is very good given the current volatility.
COT report:
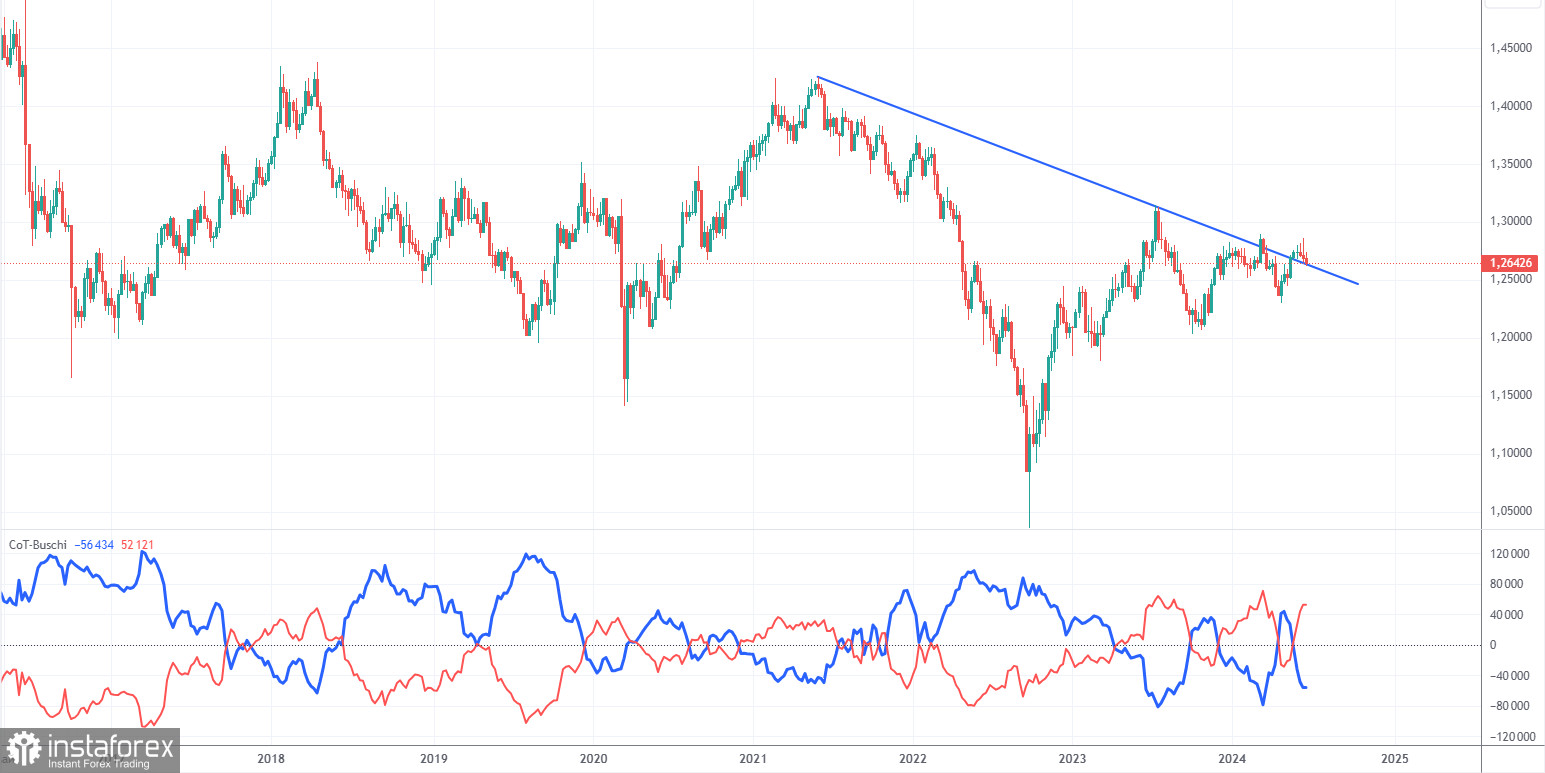
COT reports on the British pound show that the sentiment of commercial traders has frequently changed in recent years. The red and blue lines, which represent the net positions of commercial and non-commercial traders, constantly intersect and generally remain close to the zero mark. According to the latest report on the British pound, the non-commercial group opened 8,100 buy contracts and closed 700 short ones. As a result, the net position of non-commercial traders increased by 8,800 contracts over the week, which is quite significant for the pound. Thus, sellers failed to seize the initiative at the most critical moment.
The fundamental background still does not provide a basis for long-term purchases of the pound sterling, and the currency has a good chance to resume the global downward trend. However, the price has already breached the trend line on the 24-hour timeframe at least twice. The level of 1.2765 is currently preventing the pound from rising further.
The non-commercial group currently has a total of 110,300 buy contracts and 58,200 sell contracts. The bulls have taken the initiative, but aside from the COT reports, there is nothing else that suggests a potential rise in the GBP/USD pair.
Analysis of GBP/USD 1H
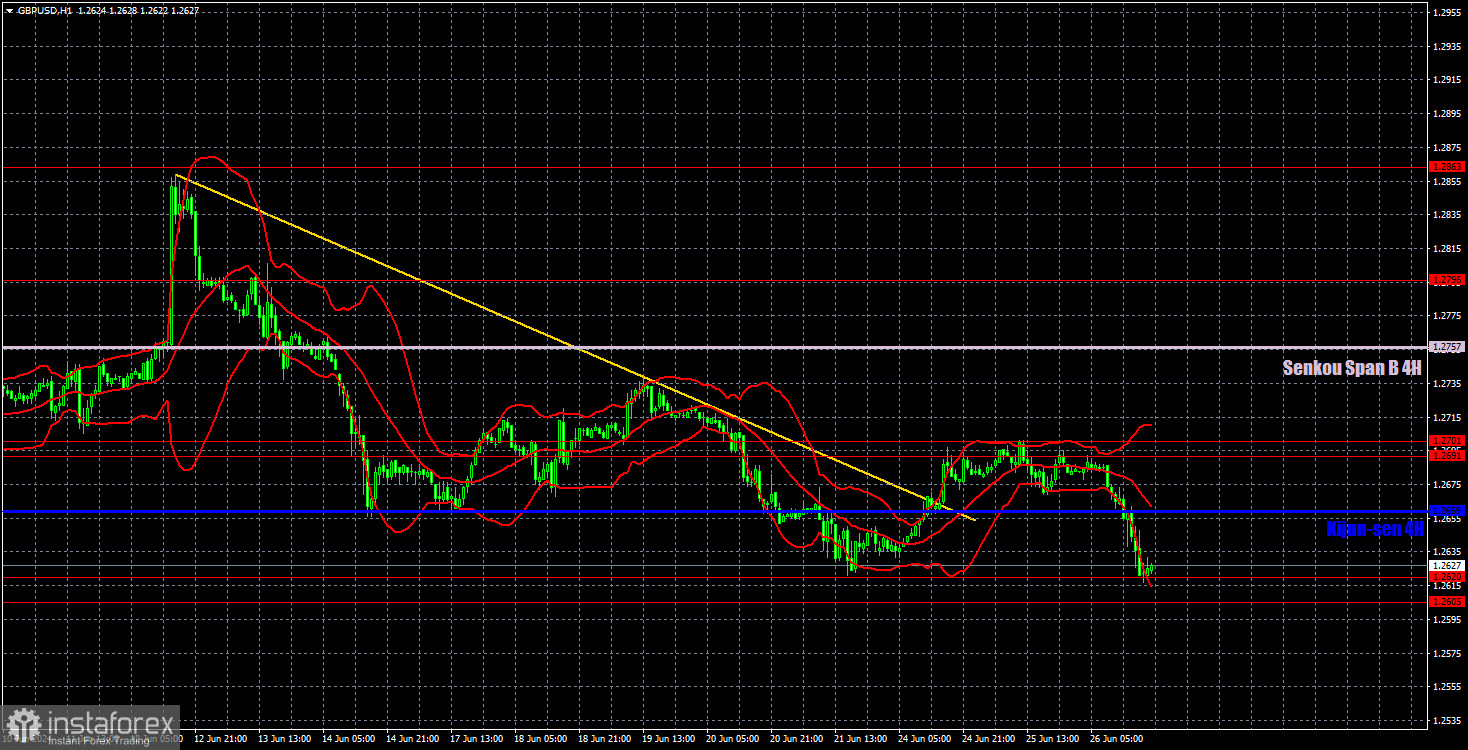
On the 1H chart, GBP/USD is doing its best to continue its downward movement but so far it has only managed to drop to the area of 1.2605-1.2620 for the second time. A new bounce from this area will push the pair into correcting upwards, and the price will head towards the area of 1.2691-1.2701. We insist that the pound fall, but it is quite naive to expect that a pair, which has shown unreasonable growth for more than six months, will suddenly start falling every day.
As of June 27, we highlight the following important levels: 1.2215, 1.2269, 1.2349, 1.2429-1.2445, 1.2516, 1.2605-1.2620, 1.2691-1.2701, 1.2796, 1.2863, 1.2981-1.2987. The Senkou Span B (1.2757) and Kijun-sen (1.2659) lines can also serve as sources of signals. Don't forget to set a Stop Loss to breakeven if the price has moved in the intended direction by 20 pips. The Ichimoku indicator lines may move during the day, so this should be taken into account when determining trading signals.
On Thursday, there are no significant events or reports scheduled in the UK. The US docket will feature several reports of secondary importance, which may provoke some market reaction. The reaction will depend on how far the actual values deviate from the forecasts. The dollar needs very strong information so it can continue to rise from its current positions. A new round of the upward correction seems more logical.
Description of the chart:
Support and resistance levels are thick red lines near which the trend may end. They do not provide trading signals;
The Kijun-sen and Senkou Span B lines are the lines of the Ichimoku indicator, plotted to the 1H timeframe from the 4H one. They provide trading signals;
Extreme levels are thin red lines from which the price bounced earlier. They provide trading signals;
Yellow lines are trend lines, trend channels, and any other technical patterns;
Indicator 1 on the COT charts is the net position size for each category of traders;