Analyzing Wednesday's trades:
GBP/USD on 1H chart
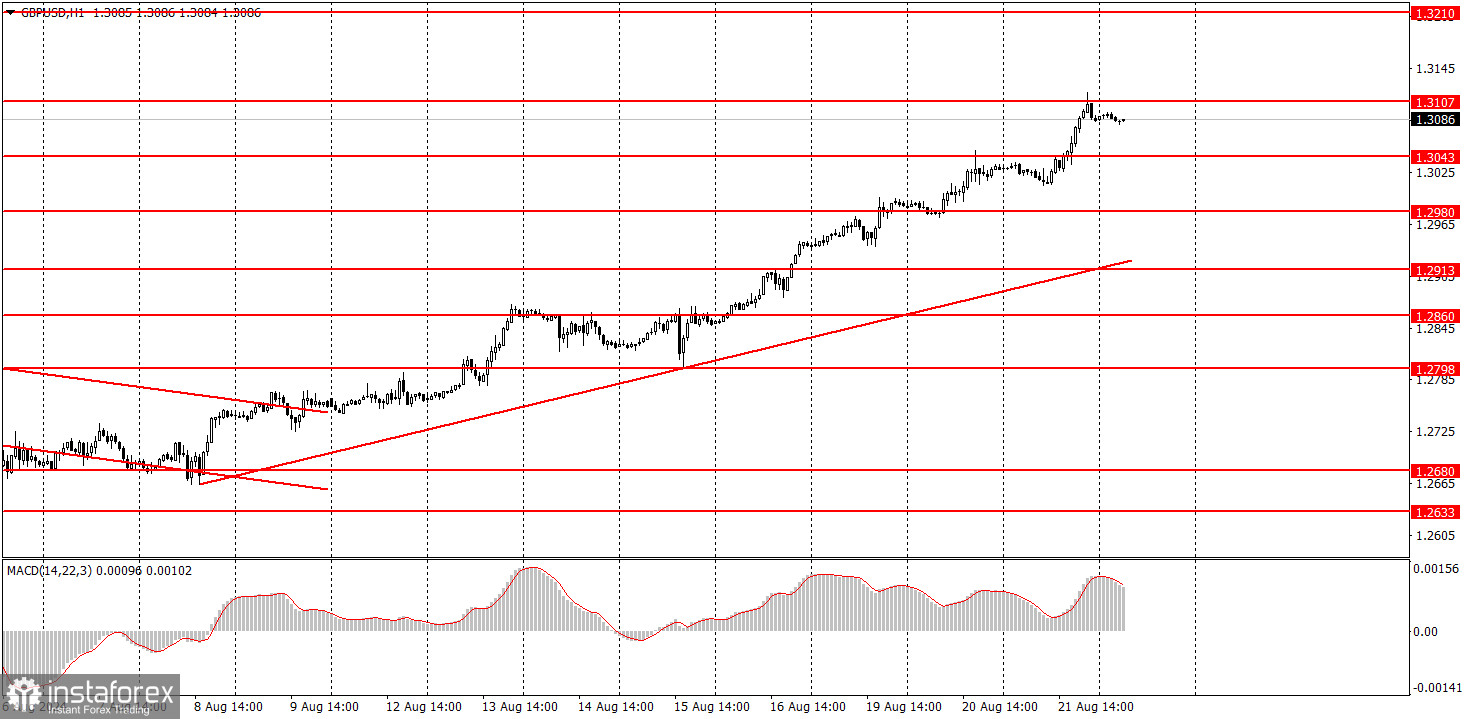
The GBP/USD pair also continued its upward movement on Wednesday. The upward movement in recent weeks has been so strong and unstoppable that it has become necessary to reduce the scale of the charts to make it at least fit on the charts. We have no doubts that the current rise in the pound is entirely illogical. The market has used any excuse to sell the US dollar for several weeks, even months, ignoring the overall fundamental and macroeconomic picture. Each subsequent report from the US is used for just one purpose.
However, from a technical perspective, the pair continues its perfectly logical upward movement. At present, there is no sign of the end of the upward trend, so traders are left with no choice but to buy the pair—assuming, of course, that you are ignoring the fundamentals and macroeconomics just like the market. Currently, the pair has already reached the level of 1.3107. A pullback from this level offers only small chances for a correction.
GBP/USD on 5M chart
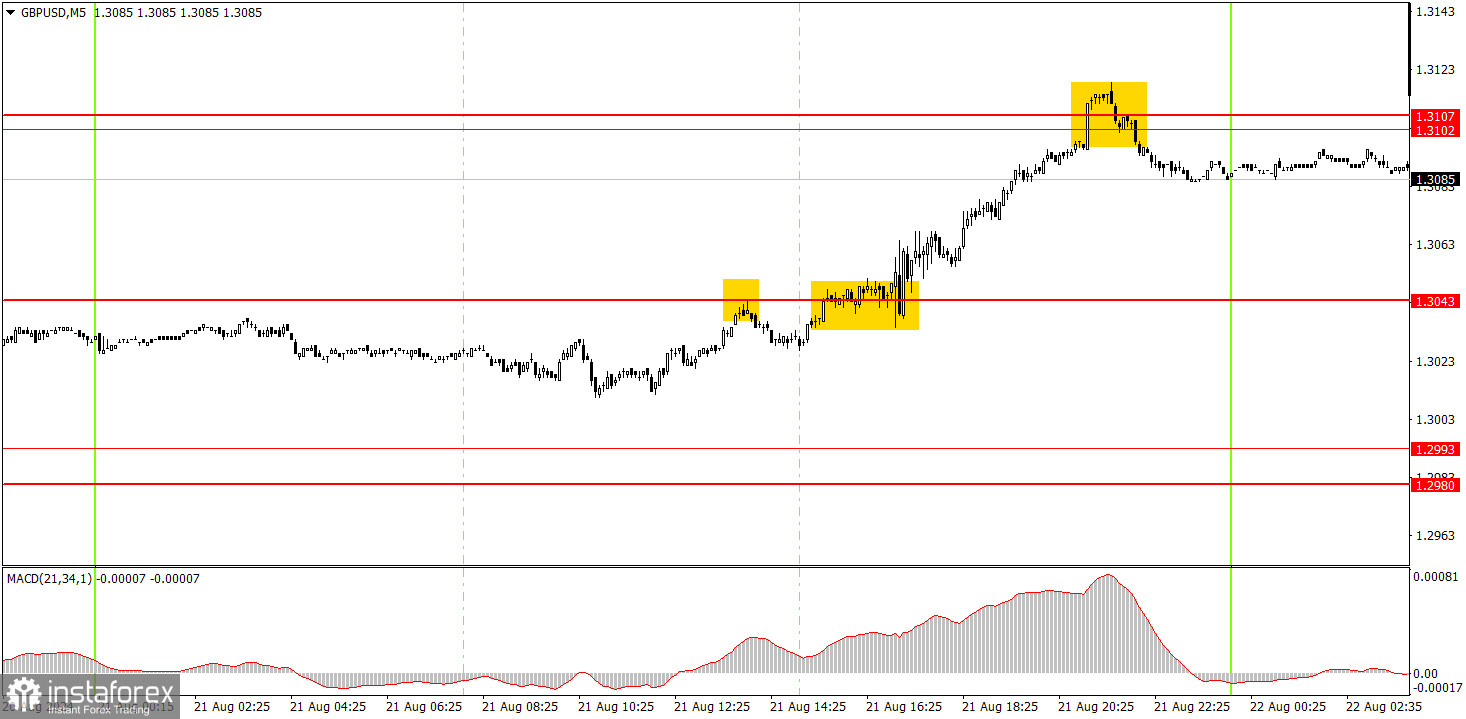
In the 5-minute time frame, three trading signals were formed on Wednesday. Initially, the pair bounced off the level of 1.3043, but this occurred an hour before the annual Non-Farm Payrolls adjustment report was released. Therefore, buying the dollar (selling the pair) was, to put it mildly, risky. However, the next buy signal around the same level should have been acted upon. The price rose quickly and straightforwardly to the nearest target area—1.3102-1.3107. A pullback from this area could even have been used for selling, as a correction is bound to start eventually.
How to trade on Thursday:
In the hourly time frame, GBP/USD has a good chance of continuing the global downtrend, but currently, a local uptrend persists. The British pound is still overbought, the dollar is undervalued, and the market continues to use every opportunity to buy the British currency and sell the dollar. It often ignores any unfavorable reports. The rare positive reports from the US, which appear from time to time, only lead to minor downward corrections.
On Thursday, the pair may experience a slight pullback, but the uptrend is unlikely to be disrupted. Short positions can be held with a target of 1.3043. A break above the 1.3102-1.3107 area would indicate further growth, with a target of 1.3145.
The key levels to consider on the 5M timeframe are 1.2605-1.2633, 1.2684-1.2693, 1.2748, 1.2791-1.2798, 1.2848-1.2860, 1.2913, 1.2980-1.2993, 1.3043, 1.3102-1.3107, 1.3145, and 1.3210. On Thursday, reports on business activity will be published in the UK, and similar reports and jobless claims will be released in the US. Given the current circumstances, these are unlikely to impact market sentiment.
Basic rules of the trading system:
1) The strength of a signal is determined by the time it takes for the signal to form (bounce or level breakthrough). The less time it took, the stronger the signal.
2) If two or more trades around a certain level are initiated based on false signals, subsequent signals from that level should be ignored.
3) In a flat market, any currency pair can form multiple false signals or none at all. In any case, it's better to stop trading at the first signs of a flat market.
4) Trades should be opened between the start of the European session and midway through the U.S. session. After this period, all trades must be closed manually.
5) In the hourly time frame, trades based on MACD signals are only advisable amidst substantial volatility and an established trend confirmed by a trendline or trend channel.
6) If two levels are too close to each other (5 to 20 pips), they should be considered support or resistance.
7) After moving 20 pips in the intended direction, the Stop Loss should be set to break even.
What's on the charts:
Support and Resistance price levels: targets for opening long or short positions. You can place Take Profit levels near them.
Red lines: channels or trend lines that depict the current trend and indicate the preferred trading direction.
The MACD (14,22,3) indicator, encompassing both the histogram and signal line, acts as an auxiliary tool and can also be used as a source of signals.
Important speeches and reports (always noted in the news calendar) can profoundly influence the movement of a currency pair. Hence, trading during their release calls for heightened caution. It may be reasonable to exit the market to prevent abrupt price reversals against the prevailing trend.
Beginners should always remember that not every trade will yield profit. Developing a clear strategy and effective money management is key to success in trading over a long period.