The pound/dollar currency pair gained volume again, showing high volatility of 161 points, which means that the previously voiced theory still works. From technical analysis (TA), we see that after a slight stop on October 23, the quote still managed to regroup trading forces and resume the recovery process. Earlier, we have discussed that the market hung some ambiguity in the actions, where, having like a huge overbought paired with the development of the psychological level of 1.3000, sellers still cannot be lured out of the symptom of FOMO (syndrome of lost profits) of the past inertial course. So, the period of October 21-23 showed a slowdown in volatility (137-137-80 points), which to some extent served as a healing process in terms of comprehension. Thus, the theory that the slowdown in terms of the decline in volatility will help to give the market a round of new jumps, with the opportunity to recover, almost coincided with the expectation.
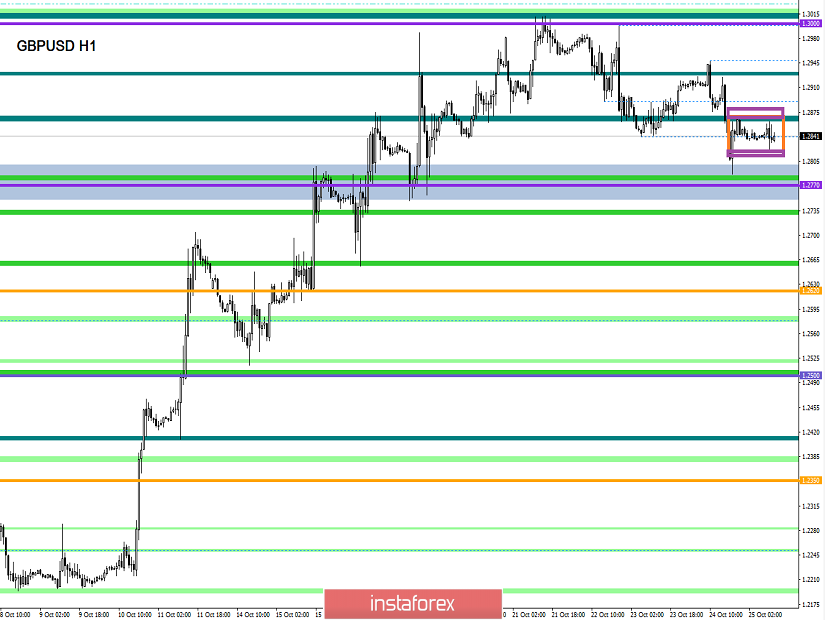
Examining every hour of the last day, we see the characteristic impulsive leaps directed downward. The main price movement came in the period of 16:00-19:00 (time on the trading terminal), where the quote managed to touch the range level of 1.2770, then forming a rebound. The subsequent oscillation was in terms of horizontal movement, with a rather narrow amplitude of 1.2835/1.2864.
As discussed in the previous review, speculators even before the decline in volatility (October 23) left previously opened short positions, with the premise that there is characteristic indecision of sellers and it is necessary to wait a little longer. As we can see, the results did not have to wait long, and on October 24, volatility resumed, and it was in terms of further recovery, which once again returned to the market speculators, but at more attractive entry points. In turn, conservative traders do not rush to hasty actions, and the entry into the market was considered only after a clear fixation of the price below 1.2770 or in the case of another FOMO and a fixation higher than 1.3000.
Looking at the trading chart in general terms (daily period), we see a clear attempt to restore the downward interest, but, again, "attempt" – no more. It's still very early to say that recovery is underway right now since there is not even 40% of the development relative to the past inertial stroke. Thus, it turns out that the emotional background of market participants is still preserved to some extent, and the characteristic overbought invariably hangs, but at the same time does not frighten these very participants in the process. In terms of market movement, we have the following picture:
• A period of 12 years is a constant downward trend to this day.
• A period of 1.5 years – holding a downward trend, with the prerequisites of a fracture.
• The period from the beginning of 2019 – V-shaped oscillation with almost 74% of the working of the downward course, having at the moment a vertical movement formed against the background of emotional and information flow.
The news background of the day was full of statistics from the United States. So, the number of applications for unemployment benefits, including primary and repeated, decreased by 7 thousand. Preliminary PMI was unchanged, but orders for durable goods collapsed, showing a decline of 1.1%. The reaction of the American dollar to poor statistics in the United States was in terms of green paper growth. What is the reason for such a striking discrepancy? The reason is the same – the information background regarding the divorce proceedings Brexit.
So what happened this time in this long-running comedy series?
British Prime Minister Boris Johnson said that if the European Union agrees to postpone Brexit for three months, he will offer to hold early parliamentary elections on December 12. If the EU grants a delay until November 15 or 30, Boris Johnson will once again try to get a draft deal through parliament. Jacob Rees-Mogg, the leader of the House of Commons, said the government will formally submit a proposal for early elections on October 28. To conduct them, Johnson needs to obtain the consent of two-thirds of the total number of deputies.
The reaction of the pound to such a move was predictable and displayed the same downward rally, which was written at the beginning of the article.
In turn, the leader of the Labor Party, Jeremy Corbyn, said they were ready for an early election, but they needed guarantees to prevent a hard exit.
"Exclude the possibility of Britain leaving the EU without an agreement, and we will support the election. I called for early elections from the very beginning, because the country needs to solve the problems of social injustice. But for this, the probability of Brexit should be excluded without a deal," Jeremy Corbyn said.
Today, in terms of the economic calendar, we have nothing interesting in terms of statistics. In terms of information background, we are waiting for specifics regarding the postponement of Brexit.
The upcoming trading week in terms of the economic calendar is full of statistics for every color and taste. The key events are the Federal Reserve meeting and the report of the United States Department of Labor. At the same time, the Brexit deadline (October 31) is coming to an end next week, which will give rise to heat in terms of information flow and comments on the divorce process.
The most interesting events displayed below:
On Tuesday, October 29th
Great Britain 10:30 London time – Bank of England consumer lending (September)
Great Britain 10:30 London time – The volume of mortgage lending (September): Prev. 3.85V – Forecast 4.20V
USA 14:00 London time – Composite home price index S&P/CS Composite-20 not seasonally adjusted (y/y) (August)
On Wednesday, October 30th
USA 13:15 London time – Change in the number of people employed in the non-agricultural sector from ADP (October)
USA 13:30 London time – Annual GDP data (Q3 preliminary): Prev. 2.0% – Forecast 1.6%
USA 19:00 London time – The Fed meeting, followed by the announcement of the interest rate
USA 20:30 London time – Press Conference of the Federal Open Market Federal Reserve Committee
On Thursday, October 31st
USA 13:30 London time – The number of repeated/primary applications for unemployment benefits
On Friday, November 1st
USA 13:30 London time – Change in the number of people employed in the non-agricultural sector (October): Prev 136K – Forecast 105K
USA 13:30 London time – Unemployment rate (October): Prev 3.5% – Forecast 3.6%
USA 13:30 London time – Average hourly wage (compared to the same period last year) (y/y) (October): Prev 2.9% – Forecast 3.0%
USA 15:00 London time – The index of business activity in the manufacturing sector (PMI) from ISM (Oct)
Further development
Analyzing the current trading chart, we see a very remarkable slowdown in the framework of 1.2834/1.2864, with local border gaps, candle shadows. We got a platform to jump on, which everyone has seen for quite some time.
In turn, speculators fixed profits at the time of convergence with the key level of 1.2770 moved into a waiting phase, where, having such a remarkable slowdown, all are preparing for the next entry into the market. As you may have guessed, the method, in this case, is "Breakdown of boundaries at the moment of inertial motion".
It is possible to assume that the existing stagnation will last for an extremely short time, and most have already noticed it, thus a breakdown may occur shortly. Tactics – monitoring of borders on the subject of inertia of the cross from the subsequent entry in the direction of inertia. At the same time, we carefully analyze the news feed for information regarding Brexit to put the most correct forecast for the further movement of the pound.
Based on the above information, we derive trading recommendations:
- We consider the buy positions in the case of inertia and breakdown at 1.2870. The approximate perspective of the move is to 1.2920-1.2945.
- We consider selling positions in the case of inertia and breakdown at 1.2820. The approximate perspective of the move is to 1.2780-1.2770.
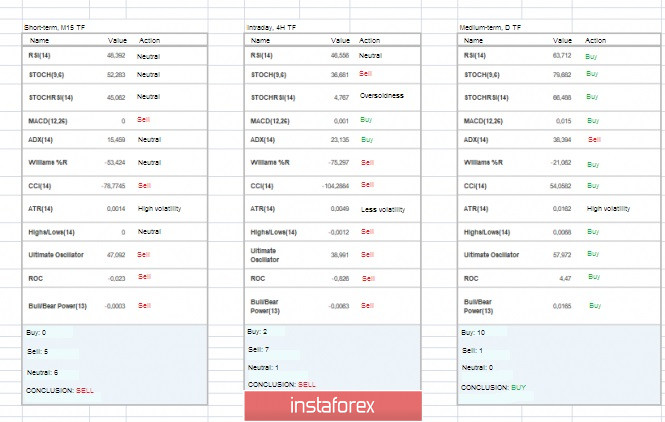
Indicator analysis
Analyzing the different sectors of timeframes (TF), we see that the indicators in the short and intraday term signal a downward course, where the minute intervals vary in the range, and the hour intervals are focused on the earlier downward momentum. The medium-term outlook invariably maintains an upward mood against the background of the emotional-inertial course that we saw earlier (October 10-21).
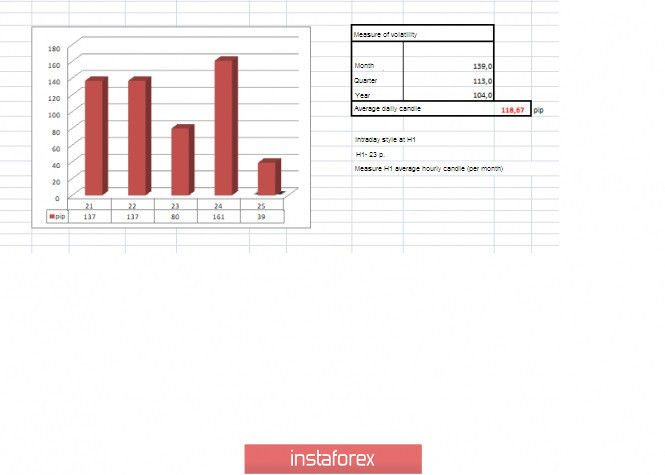
Volatility per week / Measurement of volatility: Month; Quarter; Year.
Measurement of volatility reflects the average daily fluctuation, calculated for the Month / Quarter / Year.
(October 25 was built taking into account the time of publication of the article)
The volatility of the current time is 39 points, which is a low indicator for this period. It is likely to assume that against the background of stagnation and a possible surge, we can see an acceleration in volatility.
Key levels
Resistance zones: 1.3000; 1.3170**; 1.3300**.
Support zones: 1.2770**; 1.2700*; 1.2620; 1.2580*; 1.2500**; 1.2350**; 1.2205(+/-10p.)*; 1.2150**; 1.2000***; 1.1700; 1.1475**.
* Periodic level
** Range level
*** The article is based on the principle of conducting transactions, with daily adjustments.