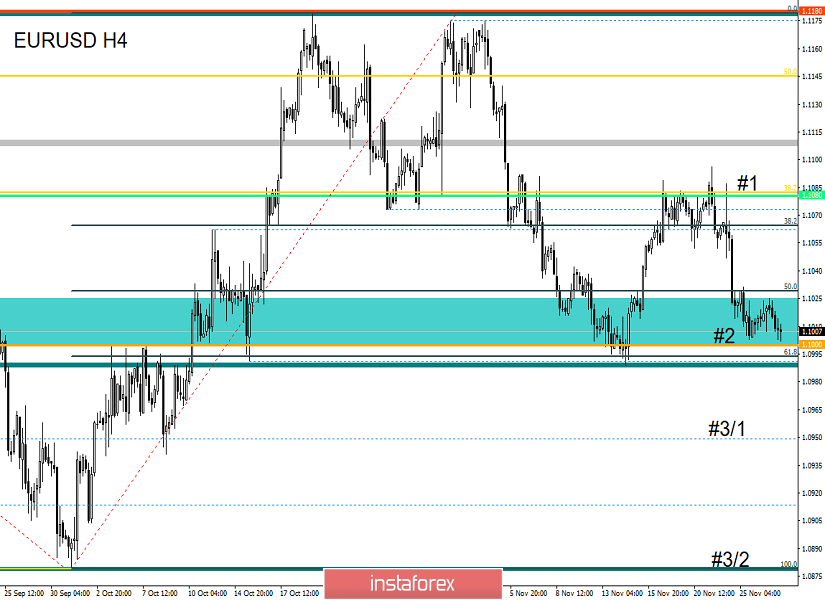
From technical analysis, we see a variable oscillation within the psychological level of 1.1000, where the quote shows extremely low activity. So, the convergence of the price with the control level of the second stage is expected to lead to a slowdown with the formation of variable boundaries 1.1000/1.1030. A re-approach to the level of 1.1000 is a good signal for an attempt to break it, but as we can see from the result, the fear of a rebound prevails in comparison with possible desires. Here we see a sluggish swag, where the volatility of the past day is only 19 points, and this is the lowest value since the summer. Whether it is necessary to be frightened by such sharp deceleration, I do not think, perhaps, it will play only on a hand. So, the repeated convergence with the key value of the recovery process, paired with a slowdown, signals the caution of market participants, at the same time, readiness, which can later be reflected in the momentum. There is only one thing left - to break through the framework and overcome the fear, then we will be able to see the finishing steps (#3/1 and #3/2), otherwise, history will repeat itself.
Analyzing the past day hourly, we see such a sluggish pullback that a kind of preservation of the mood did not allow the quote to make at least some extra steps in the market. You just look at the structure of hourly candles, almost 80% of them reflect the characteristic ambiguity.
As discussed in the previous review, traders successfully closed short positions as soon as the price approached the level of 1.1000. Subsequent actions were in the plan of waiting, tracking the values of 1.0990/1.1030 for fixing points, which did not happen in the market.
Looking at the trading chart in general terms (daily period), we see that the quote froze within the second stage of recovery relative to the oblong correction. Let me remind you that the correction from the value of 1.0879 is in the structure of the main downward trend, which weights more than a year and a half.
The news background of the past day had in itself data on sales of new homes in the United States, where previous data revised for the better from -0.7% to 4.5%, and the current figures came out worse than the forecast -0.7%. In quantitative terms, we have 733K against 738K in the previous period. In turn, the composite index of house prices confirmed expectations and came out with a figure of 2.1%.
There was no market reaction to the statistics, as well as a considerable number of speeches that were present in the past day. Yesterday, several representatives of the Fed and ECB spoke, but apparently, everything went so quietly that no one even noticed their presence. For example, the head of the Fed Jerome Powell spoke for the first time after a meeting with Donald Trump with reproaches for too high rates. But even now we do not have something new in the words of Jerome Powell.
In turn, the information background continues to discuss the recent bilateral telephone talks between the US and China regarding the long-term trade agreement, where there are no results, but in words, everything is there. So, US President Donald Trump gave his comments on the existing process, claiming that we are already in the last stages of work.
"As you know, I have very good relations with President Xi Jinping. We are in the final stages of working on a very important agreement. Perhaps the most important trade agreement in history. Things are going very well, but at the same time, we want things to go well in Hong Kong," Donald Trump told reporters at the White House.
We conclude the column of the information and news background with a major overhaul, this is how France and Germany characterized the further actions of the European Union. The EU project has been hit hard over the past decade by the debt crisis, the influx of migrants and refugees, the rise of eurosceptic populism and Brexit. This is all stated in the working paper prepared by the representatives of the two States, who intend to discuss in two stages the democratic function of the European Union, as well as problems in the field of digitalization, climate change, migration, equality, the principles of the rule of law and European values, as well as trade policy.

Today, in terms of the economic calendar, we have a fairly significant package of statistics on the United States. The first thing that catches the eye is the preliminary GDP data, where the second estimate should coincide with the first, showing a slowdown from 2.3% to 2.0%. After that, we have data on durable goods orders, which are down for the second month in a row, where for the current period the decline is 0.8%. At the end of the working day, the "Beige Book" of the Fed will be published, which is a report on the current economic situation in each of the 12 federal districts of the United States.
Further development
Analyzing the current trading chart, we see that the extremely sluggish oscillation along the psychological level of 1.1000 continues its development, where volatility leaves much to be desired, but perhaps there is a trend. This is what we hope that the current accumulation of 1.1000/1.1030 will play into the hands of volatility and there will be an acceleration. Is it worth saying that the breakdown of the level of 1.1000 with the transition to stage #3/1 will be right now? It is very desirable to see it, but with a 100% probability, it will not be argued, since there are a considerable number of factors outside our theory, and therefore it is better to take both positions (Breakdown & Rebound) and earn on the accumulation.
Detailing every minute the available portion of time, we see an extremely sluggish, but still decline from the beginning of the trading day, where the quote came close to the psychological mark of 1.1000.
In turn, traders are on a low start, carefully analyzing the behavior of the quote relative to the values of 1.0990/1.1030, as the momentum can come at any time.
It is likely to assume that the fluctuation with variable frames along the psychological mark will persist, where the trading method remains the same as it was before, "Break & Rebound". Thus, we continue to monitor the values of 1.0990/1.1030, where if the control level of 1.1000 falls, we will see the finishing stages 3/1 and 3/2.
Based on the above information, we derive trading recommendations:
- Buy positions are considered in case of price-fixing higher than 1.1035 with a prospect to 1.1055-1.1060.
- Positions for sale are considered in the case of a clear fixation of the price below 1.0985, not a puncture shadow.
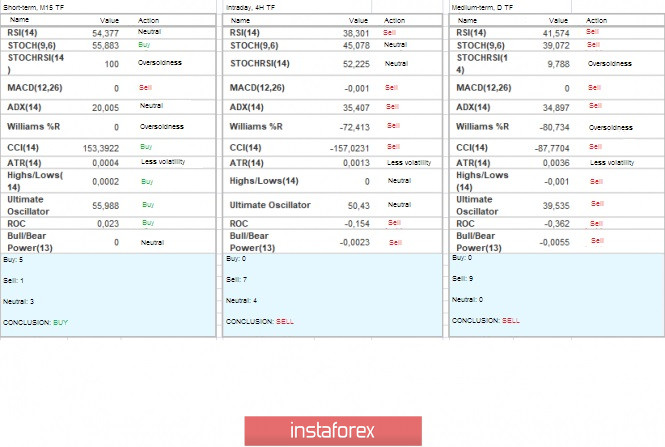
Indicator analysis
Analyzing the different sectors of timeframes (TF), we see that the indicators mostly retain downward interest, which corresponds to the general mood of the market. At the same time, short-term portions of time variably slide on accumulation, thus having a multidirectional interest.
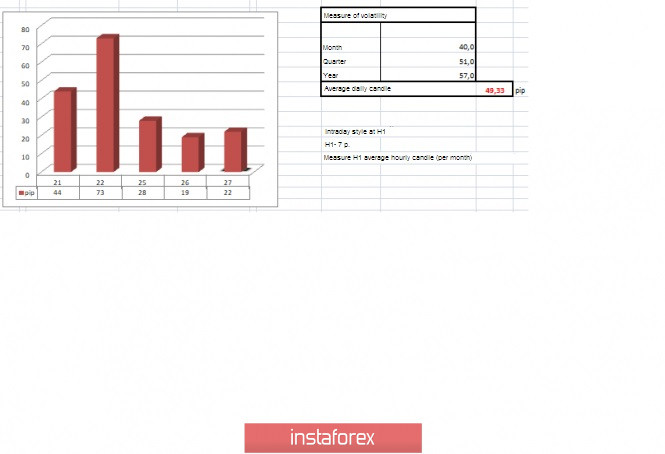
The volatility for the week / Measurement of volatility: Month; Quarter; Year.
Volatility measurement reflects the average daily fluctuation, with the calculation for the Month / Quarter / Year.
(November 27 was built taking into account the time of publication of the article)
The volatility of the current time is 22 points, which is still a low indicator for this period. It is likely to assume that once the accumulation within the benchmark level is broken through, there will be a local acceleration of volatility.
Key level
Resistance zones: 1.1080**; 1.1180* ; 1.1300**; 1.1450; 1.1550; 1.1650*; 1.1720**; 1.1850**; 1.2100.
Support zones: 1.1000***; 1.0900/1.0950**;1.0850**; 1.0500***; 1.0350**; 1.0000***.
* Periodic level
** Range level
*** Psychological level
***** The article is based on the principle of conducting transactions, with daily adjustments.