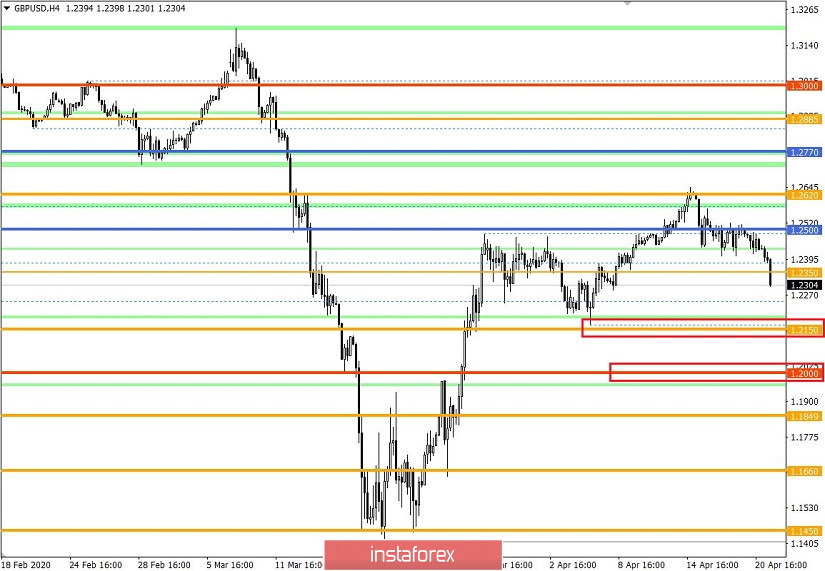
Intense downward mood is present, which pushed the quote near the control levels. Fluctuation of quotes in the variable range of 1.2405 / 1.2520 lasted for about 60 hours, during which traders rallied on the breakdown of established boundaries, which turned out to be a profitable trading tactic.
Since April 15, a downward mood was set from the resistance level of 1.2620, where market participants received a signal of a possible rollback in the future.
To confirm the movement, the quote needs to pass the levels of 1.2350 and 1.2150. However, with the current fluctuation, work is only 25% completed.
Only short positions prevailed yesterday, during which the quote traded within the lower border.
As discussed in the previous review , traders concentrated trading within the range of 1.2405-1.2520. The goal was to break down the established boundaries.
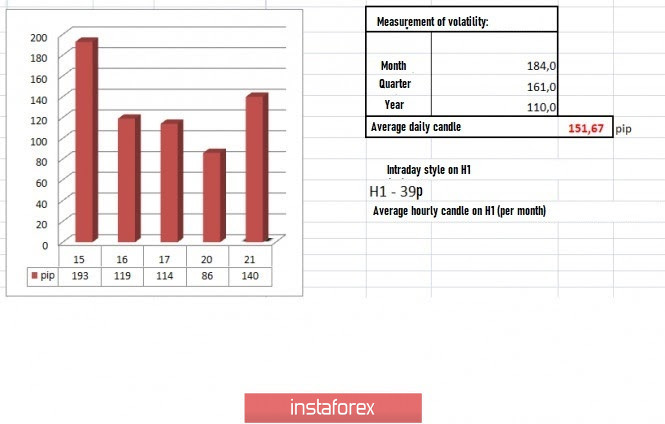
Volatility is 86 points, which is considered low for the current dynamics. If we talk about a variable flat, a value of 86 points is not really small, however, if you compare it with the previous year ...
Details of volatility: Monday - 165 points; Tuesday - 245 points; Wednesday - 172 points; Thursday - 358 points; Friday - 359 points; Monday - 144 points; Tuesday - 271 points; Wednesday - 676 points; Thursday - 354 points; Friday - 522 points; Monday - 267 points; Tuesday - 296 points; Wednesday - 333 points; Thursday - 452 points; Friday - 352 points; Monday - 148 points; Tuesday - 227 points; Wednesday - 108 points; Thursday - 126 points; Friday - 198 points; Monday - 116 points; Tuesday - 217 points; Wednesday - 131 points; Thursday - 122 points; Friday - 42 points; Monday - 87 points; Tuesday - 146 points; Wednesday - 193 points; Thursday - 119 points; Friday - 114 points; Monday - 86 points. The average daily indicator, relative to the dynamics of volatility, is 151 points [see the table of volatility at the end of the article].
The daily chart already indicates more than just a pullback at the peak. Overcoming the levels is the last step in changing the course.
Yesterday's news did not provide any macroeconomic statistics for the UK and the US.
Meanwhile, with regards to Brexit, England and Brussels resumed negotiations.
"In the format of a video conference, the second round of negotiations has begun. We must move forward in all directions: our goal is to achieve tangible progress by June. I'll have a press briefing on Friday, "Michel Barnier, head of the European Commission, tweeted.
Amid the resumption of negotiations, the Scottish government called on Prime Minister Boris Johnson to think about extending the transition period by 2 years.
"Extending the transition period will allow the United Kingdom to be as close to the EU as possible and provide an opportunity to rethink future relations," said Scottish Minister Michael Russell.
Britain's labor market data came out. Applications for unemployment benefits in March settled to 12,200, which is better than the expected 272,000. Analysts claim that the data do not reflect yet the full picture of the current situation. Next data will show the truth. With this, the pound did not rise despite the supposedly positive data on the labor market.
Further development
The significant downward interest resulted to the quote overcoming the level of 1.2350 and going down to the value of 1.2314. It can not be classified as a harmless rollback, as the movement already gained impressive proportions. Consolidating below the level of 1.2150 will successfully change the course.
Series of accelerations is observed on the minute work schedule. The first surge of short positions occurred during the Asian session, where panic associated with WTI crude oil was actively played out. The second leap came after Britain's data came out, where investors were distrustful of the latest statistical data, and continued trading the US dollar.
The market mood influenced speculative positions to continue growing, which is indicated by the candle structures.
Traders already have a partial profit when the price moves from 1.2400 to 1.2350. Short positions continue to 1.2300-1.2230 --- 1.2150
If the mood is maintained, the downward course may persist. It may even lead to the achievement of the main goal in the level of 1.2150. However, note that this is not just a fleeting move, but successive trading over several days.
Based on the above information, we derived these trading recommendations:
- Open short positions steb-by-step. Consolidation points are located in the values of 1.2300-1.2230 --- 1.2150
- Alternatively, open long positions with a rebound from the area of 1.2230.
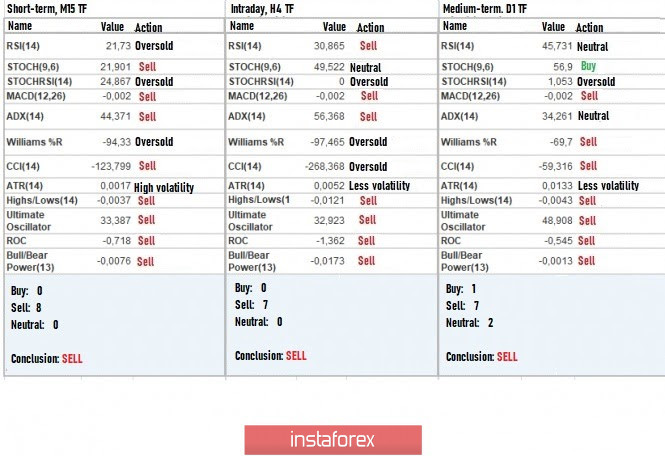
Indicator analysis
For the first time, all instruments are pointing downwards, which is a good signal for our positions.
Volatility per week / Measurement of volatility: Month; Quarter year
The measurement of volatility reflects the average daily fluctuation, calculated per Month / Quarter / Year.
(April 21 was built taking into account the time of publication of the article)
Current volatility is 140 points, which is almost comparable to the average daily indicator. Activity may still increase and exceed the average value, but everything will depend on speculative activities.
Key levels
Resistance zones: 1.2350 **; 1.2500; 1.2620; 1.2725 *; 1.2770 **; 1.2885 *; 1.3000; 1.3170 **; 1.3300 **; 1.3600; 1.3850; 1.4000 ***; 1.4350 **.
Support Areas: 1.2280 (1.2240); 1.2150 **; 1.2000 *** (1.1957); 1.1850; 1.1660; 1.1450 (1.1411); 1.1300; 1,1000; 1,0800; 1,0500; 1,0000.
* Periodic level
** Range Level
*** Psychological level
**** The article is built based on the principle of conducting a transaction, with daily adjustment