EUR/USD 5M
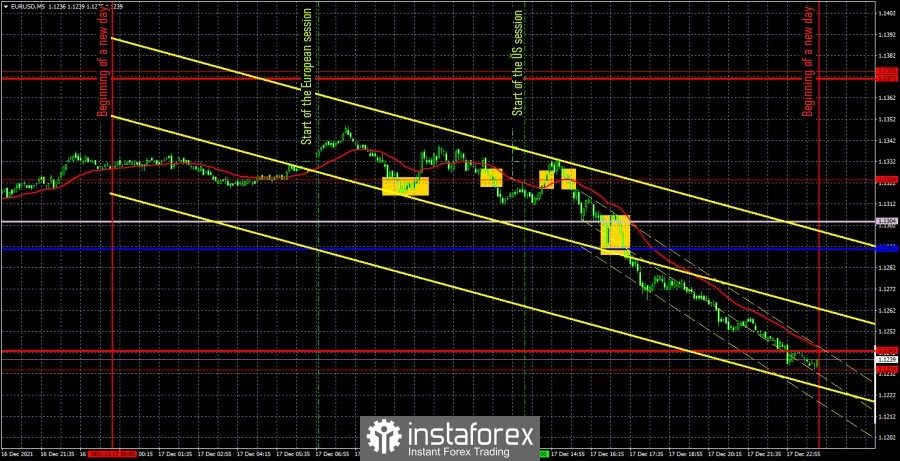
The EUR/USD pair showed excellent volatility equal to 114 points, and the most strange movement last Friday. To begin with, not a single important macroeconomic report or fundamental event was scheduled for Friday either in the US or in the European Union. Thus, how to explain the volatility, which turned out to be higher than on Wednesday or Thursday, when the results of the Federal Reserve meeting were summed up in the US, and the results of the European Central Bank meeting in the European Union, is simply unclear. In addition, from a technical point of view, the movement was also strange, since in the first half of the day the pair moved with a minimal downward slope, but more sideways than down. In the afternoon, a strong and recoilless downward movement began. Of course, you can explain anything. In our case, it is obvious that the Americans are "to blame" for the dollar's growth, since it was with the opening of their session that the downward movement intensified. At the same time, who expected such a move? Hardly anyone. In terms of trading signals, it's even worse. The first four trading signals formed around one level - the extreme of 1.1324. Recall that this is a sign of a flat. With that, there were no inaccuracies or twofold moments. The price crossed this level quite confidently each time, generating false signals. And each time the pair did not go in the right direction by even 15 points, which would allow you to set a Stop Loss to breakeven. Thus, according to the first two signals (buy and sell), which had to be worked out, a loss of 22 points was obtained. The next two signals near the level of 1.1324, for obvious reasons, should not have been worked out. And then the situation was saved by the Kijun-sen and Senkou Span B lines, which were located close to each other and they should be considered in pairs. The price managed to overcome both, which became another sell signal. Working out this short position made it possible for traders to earn about 30 points, which covered the losses on the first two transactions. Not the most successful day, but the euro/dollar pair is basically moving as strangely as possible now, which will be noticeable on the hourly timeframe.
EUR/USD 1H
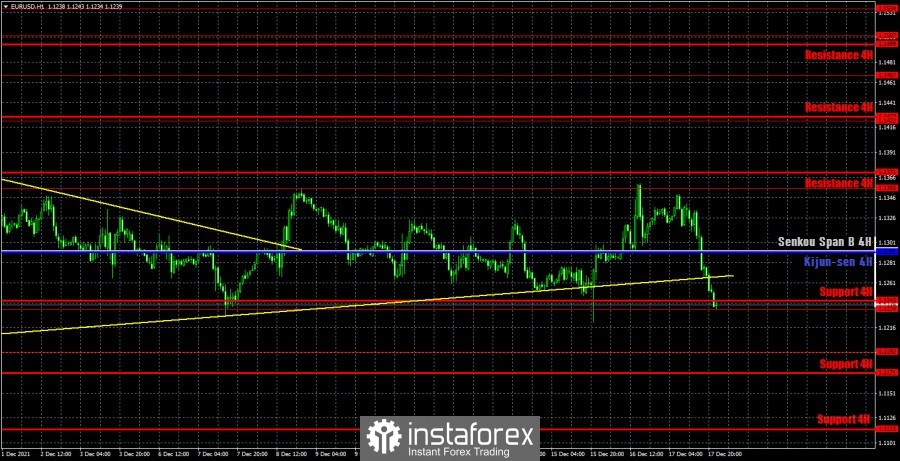
On the hourly timeframe, it is even better to see that the pair, by and large, is again inside the horizontal channel. Only now this channel is 1.1234 - 1.1355. On Friday, it fell to its lower border and at the same time overcame the rising trend line. If it manages to settle below the level of 1.1234 on Monday, then it will be possible to talk about the resumption of the downward trend. Otherwise, the pair remains inside the horizontal channel and will strive for its upper limit. On Monday, we highlight the following levels for trading - 1.1192, 1.1234, 1.1355, as well as the Senkou Span B (1.1291) and Kijun-sen (1.1291) lines. The lines of the Ichimoku indicator may change their position during the day, which should be taken into account when searching for trading signals. Signals can be "rebounds" and "breakthroughs" of these levels and lines. Do not forget about placing a Stop Loss order at breakeven if the price moves 15 points in the right direction. This will protect you against possible losses if the signal turns out to be false. There will be no interesting events and no macroeconomic publications in the European Union and the United States on December 20. Thus, traders today will have to trade on pure technique.
We recommend you to familiarize yourself:
Forecast and trading signals for GBP/USD for December 20. Detailed analysis of the movement of the pair and trade deals.
Analysis of the COT report
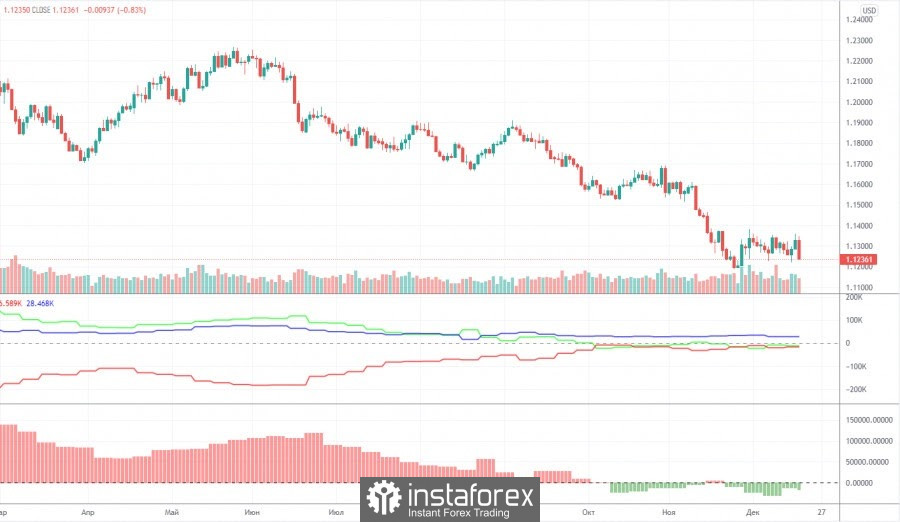
The mood of non-commercial traders has become... a little more bearish during the last reporting week (December 7-13). The "non-commercial" group of traders now has more short positions than long ones, but this advantage is minimal. The difference is only 18,000 contracts, which is not so much. During the reporting week, professional traders closed 7,200 buy contracts (longs) and 2,800 sell contracts (shorts). Thus, the net position of professional players decreased by 4,000. However, the main thing to note is that the green and red lines of the first indicator (indicating the change in the net positions of the non-commercial and commercial groups) have been near the zero level for a long time, as well as in close proximity to each other. That is, in the last few months, when the European currency continued to fall against the dollar, the major players no longer increased their shorts. Thus, the question arises, why did the euro fall at all if market participants did not sell it? Perhaps global factors, such as changes in the balance between the EU and US money supply, are interfering in the exchange rate formation process again. But according to the Commitment of Traders (COT) reports, we can only conclude that the bearish mood is minimal and has not intensified in recent months. Nevertheless, taking into account the fundamental background, the euro may continue to fall. And the technical picture does not yet give any reason to assume the completion of the fall of the euro currency. The mood of the major players remains bearish, but at the same time the bulls do not seek to change anything.
Explanations for the chart:
Support and Resistance Levels are the levels that serve as targets when buying or selling the pair. You can place Take Profit near these levels.
Kijun-sen and Senkou Span B lines are lines of the Ichimoku indicator transferred to the hourly timeframe from the 4-hour one.
Support and resistance areas are areas from which the price has repeatedly rebounded off.
Yellow lines are trend lines, trend channels and any other technical patterns.
Indicator 1 on the COT charts is the size of the net position of each category of traders.
Indicator 2 on the COT charts is the size of the net position for the non-commercial group.


