empty
04.01.2022 12:05 PM
EUR/USD analysis and forecast for January 4, 2022

Yesterday's trading on the main currency pair of the Forex market both began and ended with a decline, contrary to preliminary forecasts of a likely increase after pullbacks down. Well, in more detail, as promised yesterday, we will analyze smaller time intervals. However, for now, let's briefly talk about today's macroeconomic events. First of all, I would like to draw your attention again that the fundamental component is not always taken into account and recouped by the market. As another typical example of this factor, yesterday's data from the United States on the index of business activity in the manufacturing sector and construction costs can be cited. It is noteworthy that both indicators came out in the red zone, that is, worse than the forecast values. However, this did not prevent the US dollar from noticeably strengthening its position against the single European currency.

Retail sales data in Germany have already been published today, both seasonally adjusted and without taking into account those. Both indicators exceeded economists' expectations and turned out to be stronger than forecasts. Nevertheless, at this stage of time, it did not bring the European currency much-needed and significant support. And this is another example when the "foundation" is not completely and far from always taken into account by the market. Later, at 15:00 London time, data from the States on the level of vacancies and labor turnover will be released, and the production index of the Institute of Supply Management (ISM) will also be published. I can't say that these are very important indicators, but they can't be attributed to being too weak either. Let's see if they will have an impact on the price dynamics of EUR/USD, but for now we turn to the technical picture.

Daily

This image is no longer relevant

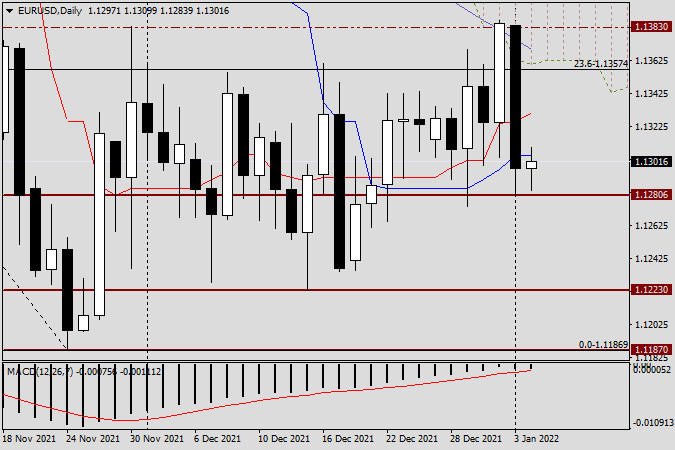
As already noted at the beginning of this article, on the first trading day of the new year, the pair showed a fairly strong bearish dynamic. Of course, you can always find some explanation for any price movement, whether it's the notorious COVID-19 strain called "Omicron" or a change in the yield of US treasuries, or some other supposedly significant reason. In my personal opinion, the main factor in yesterday's strengthening of the US dollar against the euro was (as most often happens) the technical component. And on the daily chart, at least three obstacles are clearly visible, which did not let the pair go higher and turned it in a southerly direction. First, this is the resistance level of 1.1383, over which the euro bulls failed to consolidate trading, which once again underlines the strength of this resistance of sellers. Second, the 50 simple moving average and the lower boundary of the daily cloud of the Ichimoku indicator played their role as resistance.

Another bearish positive moment was the closing of yesterday's trading below the red Tenkan line and the blue Kijun line of the Ichimoku indicator, which had previously, and more than once, provided EUR/USD with strong support. So, as a result of yesterday's not weak decline, the pair ended trading below the most important technical level of 1.1300. At the end of this article, the euro/dollar is trying to adjust to yesterday's decline and is strengthening slightly. If today's session closes above the Kijun and Tenkan lines, their breakdown can be considered false and prepare for another test for the breakdown of a strong resistance zone of 1.1383/85. Task No. 1 for players to lower the exchange rate will be to update yesterday's lows at 1.1280 and close trading under this support level, if this condition is met, the road will open for the euro/dollar to the levels of 1.1230, 1.1200 and, possibly, to the key support level of 1.1187.

H1

This image is no longer relevant

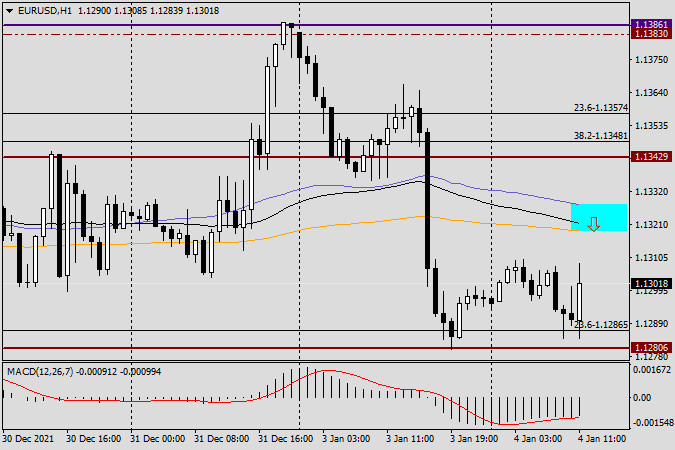
On the hourly chart, at the very end of the article, we observe a very active and quite strong growth. Most likely, the pair will rise to the moving averages used and broken the day before, which are in the circled zone 1.1319-1.1327. If a candle or a combination of bearish reversal candles appears in the selected zone on this or four-hour charts, it can be perceived as a signal to open sales. Given yesterday's strong decline and the closing of trading under the most important mark of 1.1300, in the current situation with purchases, it is better to wait and see how today's trading ends. I fully admit that taking into account the closing of today's session and the formed daily candle, we can get answers to our questions about the further direction of the quote. So far, somehow.

Ivan Aleksandrov,
الخبير التحليلي لدى شركة إنستافوركس
© 2007-2025
Summary
Urgency
Analytic
Ivan Aleksandrov
Start trade
كسب عائد من تغيرات أسعار العملات المشفرة مع إنستافوركس.
قم بتحميل منصة التداول ميتاتريدر 4 وافتح أول صفقة.
  • Grand Choice
    Contest by
    InstaForex
    InstaForex always strives to help you
    fulfill your biggest dreams.
    انضم إلى المسابقة

المقالات الموصى بها

اليورو/الدولار الأمريكي. 25 يوليو. البنك المركزي الأوروبي يراقب مفاوضات التجارة بين الاتحاد الأوروبي والولايات المتحدة

في يوم الخميس، تداول زوج اليورو/الدولار الأمريكي بشكل جانبي. لم يكن لنتائج اجتماع البنك المركزي الأوروبي تأثير يُذكر على معنويات السوق، وكان الاجتماع نفسه خالياً من الأحداث المهمة. ونتيجة لذلك،

Samir Klishi 12:39 2025-07-25 UTC+2

التوقعات لزوج الجنيه الإسترليني/الدولار الأمريكي في 25 يوليو 2025

على الرسم البياني لكل ساعة، ارتد زوج الجنيه الإسترليني/الدولار الأمريكي يوم الخميس من مستوى تصحيح 50.0% عند 1.3579، وانعكس لصالح الدولار الأمريكي، واستقر تحت مستوى فيبوناتشي 61.8% عند 1.3530. لذلك،

Samir Klishi 12:12 2025-07-25 UTC+2

توقعات الفوركس 25/07/2025: اليورو/الدولار الأمريكي، الدولار الأسترالي/الدولار الأمريكي، الدولار الأمريكي/الين الياباني، الجنيه الإسترليني/الدولار الأمريكي، الذهب، إيثريوم وبيتكوين

روابط مفيدة: مقالاتي الأخرى متوفرة في هذا القسم دورة InstaForex للمبتدئين التحليلات الشائعة افتح حساب تداول مهم: يجب على المبتدئين في تداول الفوركس أن يكونوا حذرين للغاية عند اتخاذ القرارات

Sebastian Seliga 11:02 2025-07-25 UTC+2

GBP/USD: الزوج يشكل نمط انعكاس الاتجاه - "الرأس والكتفين"

لا يزال الجنيه الإسترليني تحت الضغط بسبب الوضع الاقتصادي الصعب في المملكة المتحدة. تؤكد البيانات الاقتصادية الأخيرة هذا الأمر، مما يؤثر بطبيعة الحال على الطلب على الجنيه. أثارت أرقام التصنيع

Pati Gani 09:57 2025-07-25 UTC+2

إشارات التداول للذهب (XAU/USD) للفترة من 25 إلى 28 يوليو 2025: الشراء فوق 3,359 دولار والبيع تحت 3,392 دولار (21 SMA - 6/8 Murray)

يتداول الذهب حول 3,359، فوق الدعم المهم عند 6/8 Murray وتحت 21 SMA. بعد أن وصل الذهب إلى مقاومة قوية عند 8/8 Murray، قام بتصحيح تقني حاد ومن المحتمل الآن

Dimitrios Zappas 08:01 2025-07-25 UTC+2

إشارات التداول لعملة البيتكوين للفترة من 25 إلى 28 يوليو 2025: الشراء فوق 115,000 دولار (5/8 Murray - 21 SMA)

إذا استمر البيتكوين في الانخفاض، ينبغي أن نتوقع حدوث تماسك تحت مستوى 5/8 Murray، ثم يمكن أن يصل سعر البيتكوين إلى حوالي $113,519 بالقرب من 200 EMA ومستوى 4/8 Murray

Dimitrios Zappas 07:59 2025-07-25 UTC+2

إشارات التداول لليورو/الدولار الأمريكي للفترة من 25 إلى 28 يوليو 2025: بيع تحت 1.1741 (21 SMA - 8/8 Murray)

في وقت مبكر من الجلسة الأوروبية، يتداول زوج اليورو/الدولار الأمريكي حول مستوى 1.174، حيث يخضع لتصحيح تقني بعد محاولة كسر مستوى 1.1790. من المحتمل أن يستمر اليورو في الانخفاض

Dimitrios Zappas 07:57 2025-07-25 UTC+2

توقعات EUR/USD ليوم 25 يوليو 2025

في اللحظة الأخيرة، خفف اليورو من التوتر وتخلى عن محاولته لإعادة اختبار الحد العلوي لقناة السعر. أُغلِق اليوم تحت خط MACD اليومي، ومؤشر مارلين على وشك الدخول إلى المنطقة السلبية

Laurie Bailey 05:06 2025-07-25 UTC+2

توقعات GBP/USD ليوم 25 يوليو 2025

فشل الجنيه الإسترليني في التغلب على ضغط خط التوازن اليومي. بالأمس، انخفض السعر بمقدار 69 نقطة، واستمر هذا الانخفاض حتى الصباح. وقد اتجه خط الإشارة لمذبذب مارلين نحو الأسفل

Laurie Bailey 05:06 2025-07-25 UTC+2

توقعات USD/JPY ليوم 25 يوليو 2025

زوج USD/JPY يظهر اتجاهًا صعوديًا قويًا. بعد الارتداد من مستوى الدعم عند 146.29، يتجه السعر الآن نحو الهدف الأقرب عند 149.38. هذا التحرك مدعوم بمؤشر Marlin، الذي اتجه صعودًا

Laurie Bailey 05:06 2025-07-25 UTC+2
لا تستطيع التحدث الآن؟
اطرح سؤالك في الدردشة.
Widget callback
 

Dear visitor,

Your IP address shows that you are currently located in the USA. If you are a resident of the United States, you are prohibited from using the services of InstaFintech Group including online trading, online transfers, deposit/withdrawal of funds, etc.

If you think you are seeing this message by mistake and your location is not the US, kindly proceed to the website. Otherwise, you must leave the website in order to comply with government restrictions.

Why does your IP address show your location as the USA?

  • - you are using a VPN provided by a hosting company based in the United States;
  • - your IP does not have proper WHOIS records;
  • - an error occurred in the WHOIS geolocation database.

Please confirm whether you are a US resident or not by clicking the relevant button below. If you choose the wrong option, being a US resident, you will not be able to open an account with InstaForex anyway.

We are sorry for any inconvenience caused by this message.