EUR/USD 5M

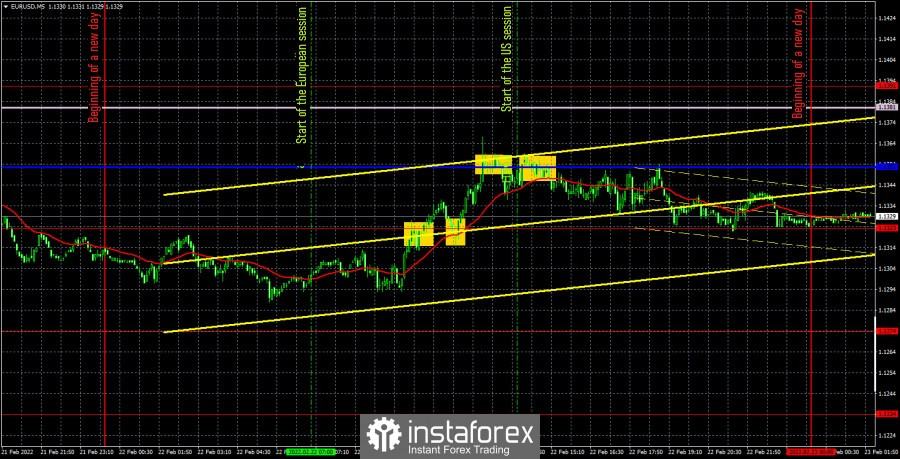
The EUR/USD pair tried to trade adequately during the second trading day of the week. However, this adequacy ended very quickly. It is possible to note only one more or less trending segment during the day, when the price rose from 1.1294 to 1.1366. Volatility was again average in strength. That is, the pair did not stand still, but still this is not the best movement. Something else is bad. The market completely ignored all the macroeconomic statistics of the day, although it was not the most important one. Nevertheless, reports on business activity in the US could provoke at least a slight strengthening of the US currency in the afternoon. But that didn't happen. Or the reaction was so weak that it could not be distinguished from the market noise. The same goes for geopolitics. Despite the fact that important decisions were made on Donbas last night, and today the first sanctions were imposed by Western countries against the DPR, LPR and the Russian Federation, the market did not react to these reports in any way.
Now consider the trading signals. First of all, it should be noted that the first two signals were formed when the pair had already passed half the way up. The price first overcame the extreme level of 1.1323, and then rebounded from it from above. Thus, it was necessary to open long positions here. They should have been closed on the rebound from the critical Kijun-sen line, of which there were as many as two and they also did not differ in particular accuracy. But on these rebounds, it was already possible to open short positions. However, until the evening, the bears did not manage to lower the pair to the level of 1.1323, so the deal had to be closed manually. As a result, it was possible to make a small profit on both transactions.
COT report

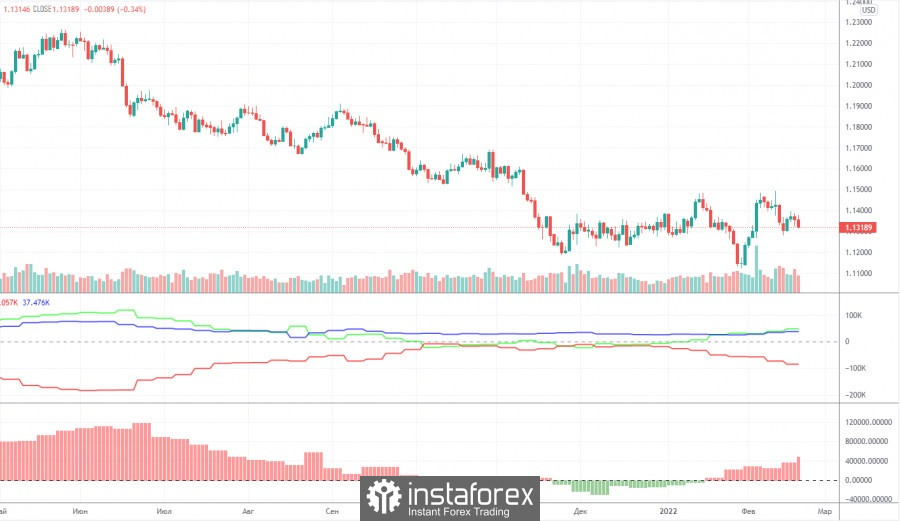
The new Commitment of Traders (COT) report, which was released on Friday, showed a new strengthening of the bullish mood among professional traders. This time, the "non-commercial" group closed about 7,000 contracts for short positions on the euro and opened 5,000 contracts for long positions. Thus, the net position increased by 12,000, which is clearly visible on the second indicator in the chart above. The total number of long positions exceeds the number of short positions by 50,000, so now we can really say that a new upward trend is beginning to form. It would be possible to say, if not for one "but". The European currency is not growing. It does not grow even at a time when there seem to be technical grounds for this. And they are quite simple: the pair has been falling for 14 months, so a correction is a fairly likely scenario. However, the fundamental background does not allow the euro to grow, so it is located very close to its annual lows. Actually, only 100 points away from them. Moreover, after the quotes fell to the level of 1.1180 at the end of November, traders failed to adjust the currency pair normally. The highest deviation from the lows was 360 points. Thus, we would say that now the data of COT reports do not coincide with the fundamental background and the technical picture that we see on a daily basis. And this is very strange, given the small influence of central banks on the money supply at this time.
We recommend to familiarize yourself with:
Overview of the EUR/USD pair. February 23. The "swing" continues. We are moving away from geopolitics, returning to the economy.
Overview of the GBP/USD pair. February 23. The pound is growing, but its growth potential is limited to the 35th level.
Forecast and trading signals for GBP/USD on February 23. Detailed analysis of the movement of the pair and trading transactions.
EUR/USD 1H

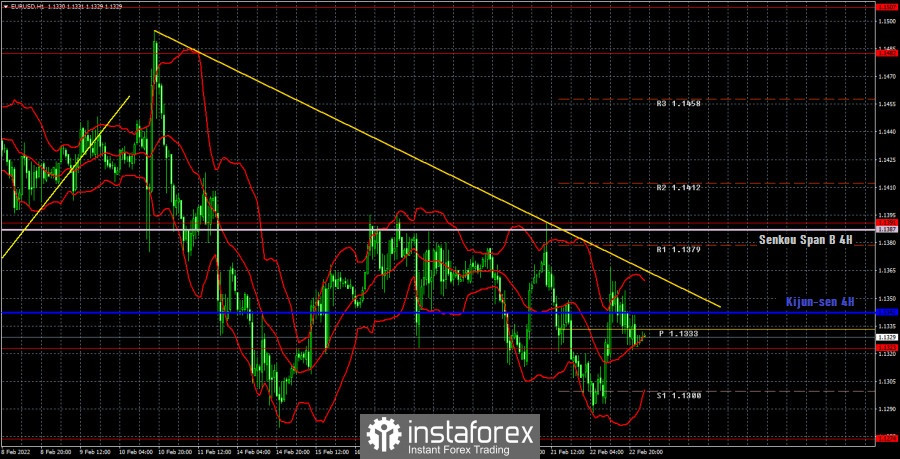
A descending trend line has finally been formed on the hourly timeframe. However, given the nature of the current movement, we have serious reasons to believe that it is very weak and can be overcome at any moment. Recall that the movement of the euro/dollar pair now looks most like a flat, not a trend, and all macroeconomic statistics (which are already a little) are ignored. We allocate the following levels for trading on Wednesday – 1.1192, 1.1234, 1.1274, 1.1323, 1.1391, 1.1482, as well as the Senkou Span B (1.1387) and Kijun-sen (1.1342) lines. There are also support and resistance levels, but no signals will be formed near them. The lines of the Ichimoku indicator may change their position during the day, which should be taken into account when searching for trading signals. Signals can be "bounces" and "breakthrough" levels - extremes and lines. Do not forget about placing a Stop Loss order at breakeven if the price went in the right direction of 15 points. This will protect you against possible losses if the signal turns out to be false. No important events and publications planned in the European Union on February 23. The same is true in the US. Only the inflation report can be noted, but this is the second estimate for January, so the market reaction to it is unlikely to follow.
Explanations for the chart:
Support and Resistance Levels are the levels that serve as targets when buying or selling the pair. You can place Take Profit near these levels.
Kijun-sen and Senkou Span B lines are lines of the Ichimoku indicator transferred to the hourly timeframe from the 4-hour one.
Support and resistance areas are areas from which the price has repeatedly rebounded off.
Yellow lines are trend lines, trend channels and any other technical patterns.
Indicator 1 on the COT charts is the size of the net position of each category of traders.
Indicator 2 on the COT charts is the size of the net position for the non-commercial group.


