EUR/USD 5M
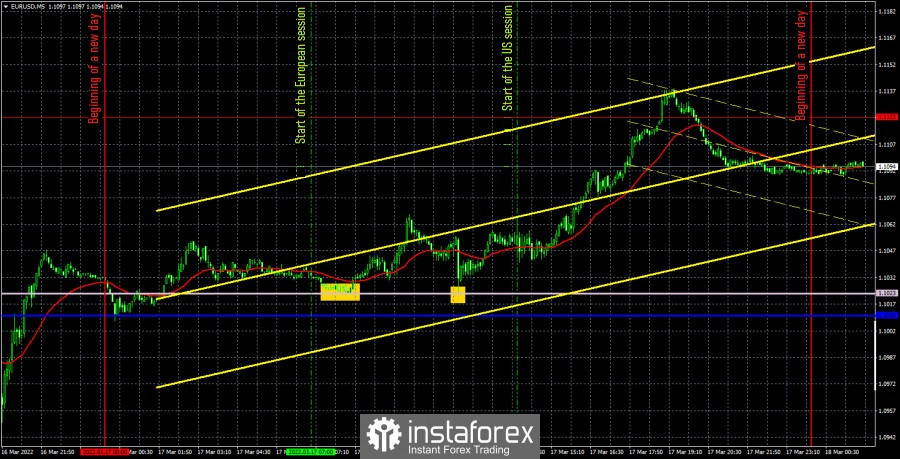
Yesterday, the EUR/USD pair continued its upward movement. If it was relatively weak during the European trading session, then the fall of the dollar intensified in the US one. Thus, yesterday did not answer the question why, after the Federal Reserve raised the rate by 0.25%, the first in the last three years, the market began to get rid of the dollar. Nevertheless, there is a certain logic, as we said earlier. It's just not obvious. It is possible that traders have worked out the rate hike in advance, since people have known about it for a long time. Therefore, we saw the opposite movement from the pair. Anyway, now the euro is growing after a long decline, which may also be caused by technical reasons. The European Union published an inflation report for February, but in the second assessment. This estimate was not much different from the first one – inflation increased by a total of 5.9% y/y. European Central Bank President Christine Lagarde also gave a speech, but, as we can see, there were no serious movements and price changes at the European session. Although, when the euro fell by 30 points within five minutes, it happened exactly at the time of the release of the inflation report.
There were exactly two trading signals on Thursday. The pair bounced off the Senkou Span B line twice, which is even better seen on the 4-hour timeframe by the Ichimoku indicator. Thus, twice traders had the opportunity to open long positions. For the first time, the pair went up 30 points, but this deal most likely closed at zero on a Stop Loss. For the second time – 80 points and the price managed to rise to the important level of 1.1122, where it was possible to take profits.
COT report:
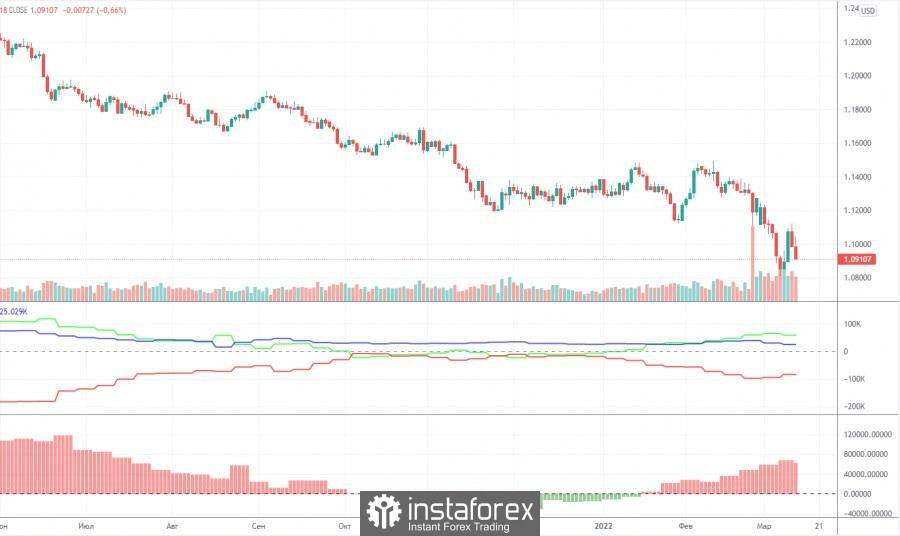
The new Commitment of Traders (COT) report, which was released on Friday, showed a weakening of the "bullish" mood among professional traders. The first weakening in the last few months. We have already drawn the attention of traders to the fact that major players were actively building up long positions, but at the same time the euro was falling and continues to do so. This time, the "non-commercial" group has opened about 15,000 long positions and 20,500 short positions. Thus, the net position decreased by 5,500. Despite this decrease, the overall mood remains bullish, and the trend is downward. The problem is that the demand among major players for the euro currency may be growing, but at the same time the demand for the US currency is also growing and at a much higher rate. Therefore, we are now dealing not with a classic market situation, when the demand for one currency is growing and the second is declining, but with a situation where the demand is growing for both currencies, but one of them is much faster and stronger. From our point of view, this explains the growth of the dollar in recent weeks on all fronts. Thus, now the data of the COT reports simply do not coincide with what is actually happening with the euro/dollar pair. Therefore, it is impossible to make a forecast for the pair based on COT reports.
We recommend to familiarize yourself with:
Overview of the EUR/USD pair. March 18. The Fed did not surprise with its decisions and announcements. Traders reacted ambiguously.
Overview of the GBP/USD pair. March 18. The Bank of England raised its key rate by 0.25% following the Fed.
Forecast and trading signals for GBP/USD on March 18. Detailed analysis of the movement of the pair and trading transactions.
EUR/USD 1H
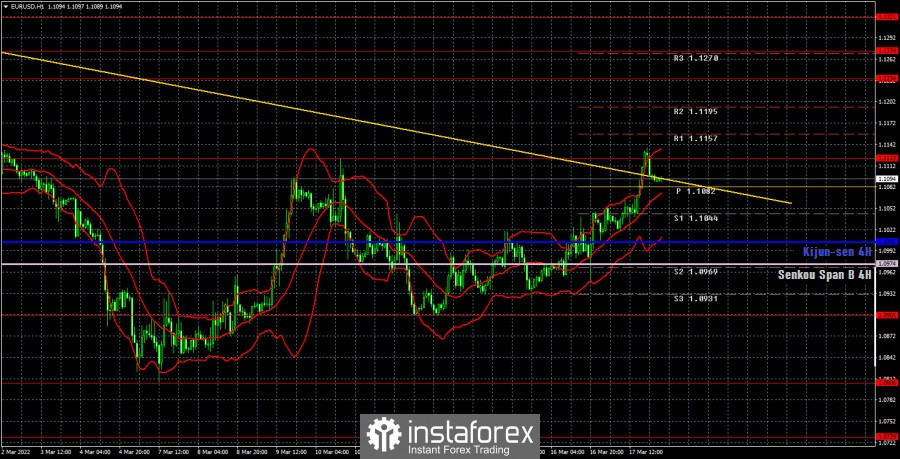
The pair finally managed to adjust to the trend line and work it out on the hourly timeframe during the day. And even overcome it. Thus, the trend has now formally changed to an upward one. But the pair has yet to overcome the important level of 1.1122. If this does not happen, then the whole campaign to the upside may end before it has even really begun. However, the euro is trying to reverse the downward trend and this is a fact. It is also a fact that the euro's growth has not been completely logical recently from the point of view of the "foundation". On Friday, we allocate the following levels for trading - 1.0901, 1.1122, 1.1234, as well as the Senkou Span B (1.0974) and Kijun-sen (1.1005) lines. There are also support and resistance levels, but no signals will be formed near them. The lines of the Ichimoku indicator may change their position during the day, which should be taken into account when searching for trading signals. Signals can be "bounces" and "breakthrough" levels - extremes and lines. Do not forget about placing a Stop Loss order at breakeven if the price went in the right direction of 15 points. This will protect you against possible losses if the signal turns out to be false. Not a single important event or publication is planned in the European Union and the US on March 18. Thus, during the day, traders will have nothing to react to, and the pair will try to overcome and settle above the level of 1.1122.
Explanations for the chart:
Support and Resistance Levels are the levels that serve as targets when buying or selling the pair. You can place Take Profit near these levels.
Kijun-sen and Senkou Span B lines are lines of the Ichimoku indicator transferred to the hourly timeframe from the 4-hour one.
Support and resistance areas are areas from which the price has repeatedly rebounded off.
Yellow lines are trend lines, trend channels and any other technical patterns.
Indicator 1 on the COT charts is the size of the net position of each category of traders.
Indicator 2 on the COT charts is the size of the net position for the non-commercial group.


