GBP/USD 5M
The GBP/USD currency pair also tried to continue corrective growth on Monday. But nothing came of it. The pound made two attempts to continue strengthening against the dollar, but both ended below the level of 1.2342. That is, below the last local high. Thus, we can draw the same conclusion as for the euro: the pound is able to continue a sluggish corrective growth (when the absolute flat ends), but it is unlikely that it is capable of medium-term growth and a new upward trend on higher timeframes. Macroeconomic and fundamental backgrounds were practically absent on Monday. Even a single report in the US on orders for durable goods cannot be considered an exhausted market. During the day, the pair constantly changed direction, riding the "swing" during the day.
Nevertheless, two trading signals were still formed. Of course, we cannot call them "ideal" or even "good". The first signal was pretty good when the price bounced perfectly from the Senkou Span B line. After that, it managed to go in the right direction for 55 points, but failed to reach the nearest target level of 1.2342. Therefore, profit on this transaction could only be obtained by closing it manually. It was impossible to get a loss at all, since Stop Loss had to be set to breakeven. Further, the second buy signal, when the price rebounded from the Kijun-sen area - 1.2259 - Senkou Span B. It was not the most accurate, and the price after its formation went up 30 points. Again, it was impossible to get a loss, and there could be a profit only if traders closed the deal manually.
COT report:
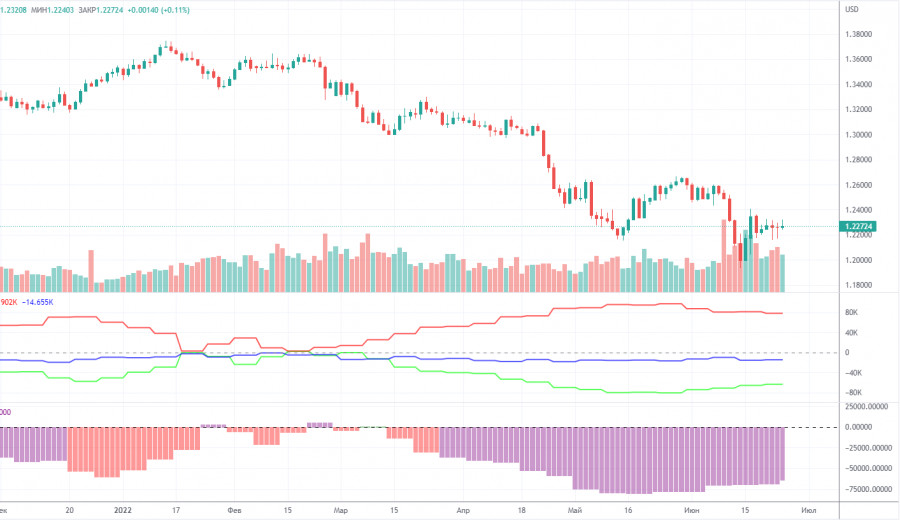
The latest Commitment of Traders (COT) report again showed insignificant changes. During the week, the non-commercial group closed 800 long positions and 3,200 short positions. Thus, the net position of non-commercial traders increased by 2,400. However, the mood of major players still remains "pronounced bearish". And the pound, despite the growth of the net position, still cannot start an upward trend. The net position has been falling for three months, which is perfectly visualized by the green line of the first indicator in the chart above or the histogram of the second indicator. Therefore, two or three insignificant increases in this indicator hardly unequivocally indicate the end of the downward trend for the pound. The non-commercial group currently has a total of 92,000 short positions open and only 28,000 longs. As you can see, the difference between these numbers is more than three times. Thus, in the case of the pound, both the demand for the dollar remains high and the demand for the pound itself remains low. What to expect from the pair with such input data? Moreover, we see very well that neither macroeconomic statistics nor fundamental events support the UK currency. We can only count on corrective growth, but we believe that sooner or later the global downtrend will resume.
We recommend to familiarize yourself with:
Overview of the EUR/USD pair. June 28. Christine Lagarde will speak every day, and inflation will continue to rise in the European Union.
Overview of the GBP/USD pair. June 28. The British pound completely repeats the trajectory of the euro.
Forecast and trading signals for EUR/USD on June 28. Detailed analysis of the movement of the pair and trading transactions.
GBP/USD 1H
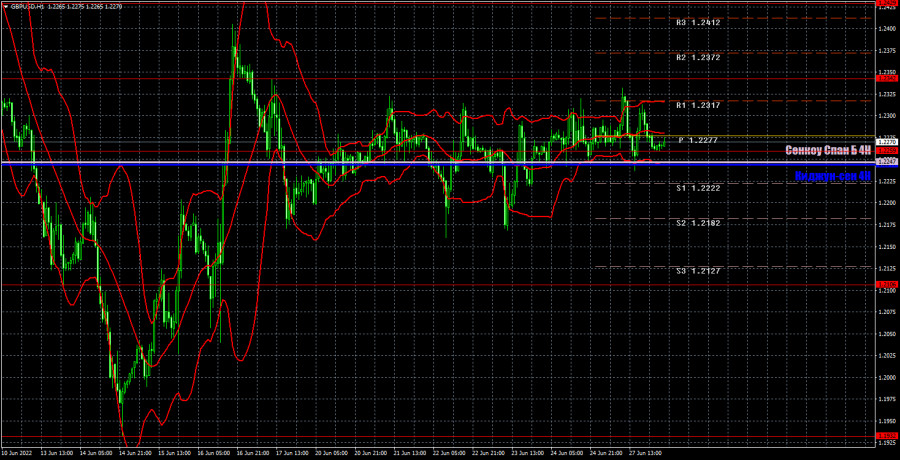
The flat is clearly visible on the hourly timeframe. The lines of the Ichimoku indicator have almost merged, which means they are very weak. Good signals can form around them, but the probability of this decreases in a flat. Thus, it is up to each trader to decide whether or not to trade the pair at this time, but we warn that the trading situation for both major pairs is now extremely unfavorable. Today, we highlight the following important levels: 1.2106, 1.2259, 1.2342, 1.2429, 1.2458, 1.2589. Senkou Span B (1.2247) and Kijun-sen (1.2246) lines can also be sources of signals. Signals can be "rebounds" and "breakthrough" of these levels and lines. The Stop Loss level is recommended to be set to breakeven when the price passes in the right direction by 20 points. Ichimoku indicator lines can move during the day, which should be taken into account when determining trading signals. The chart also contains support and resistance levels that can be used to take profits on trades. No major events are scheduled for Tuesday in the UK, nor in the US. Thus, traders will have nothing to react to during the day. There is a high probability of maintaining a flat or "swing".
Explanations for the chart:
Support and Resistance Levels are the levels that serve as targets when buying or selling the pair. You can place Take Profit near these levels.
Kijun-sen and Senkou Span B lines are lines of the Ichimoku indicator transferred to the hourly timeframe from the 4-hour one.
Support and resistance areas are areas from which the price has repeatedly rebounded off.
Yellow lines are trend lines, trend channels and any other technical patterns.
Indicator 1 on the COT charts is the size of the net position of each category of traders.
Indicator 2 on the COT charts is the size of the net position for the non-commercial group.


