empty
 
 
29.06.2022 09:10 AM
Hot forecast for EUR/USD on 29/06/2022

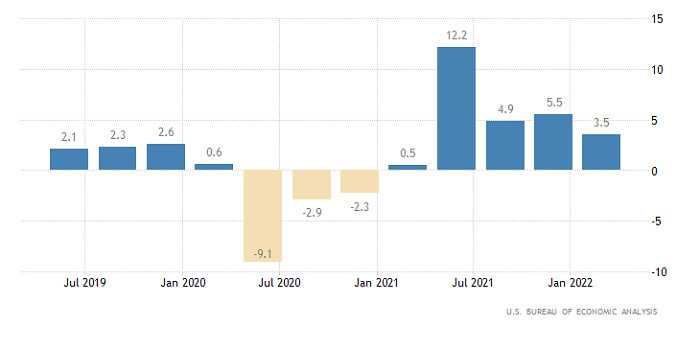
Investors rely solely on technical factors in the absence of any macroeconomic data. And after reaching the upper limit of the 1.05-1.06 range, the single European currency began to move towards just its lower limit. And apparently, today we will see a mirror image of this movement. That is, the euro will gradually grow towards the upper limit of the range. Since today's macroeconomic calendar is also almost empty. Only the final data on the GDP of the United States for the first quarter will be published. But it should confirm preliminary estimates that showed a slowdown in economic growth from 5.5% to 3.5%. However, the market has long taken into account this fact, so investors will not learn anything new for themselves.

Change in GDP (United States):

This image is no longer relevant

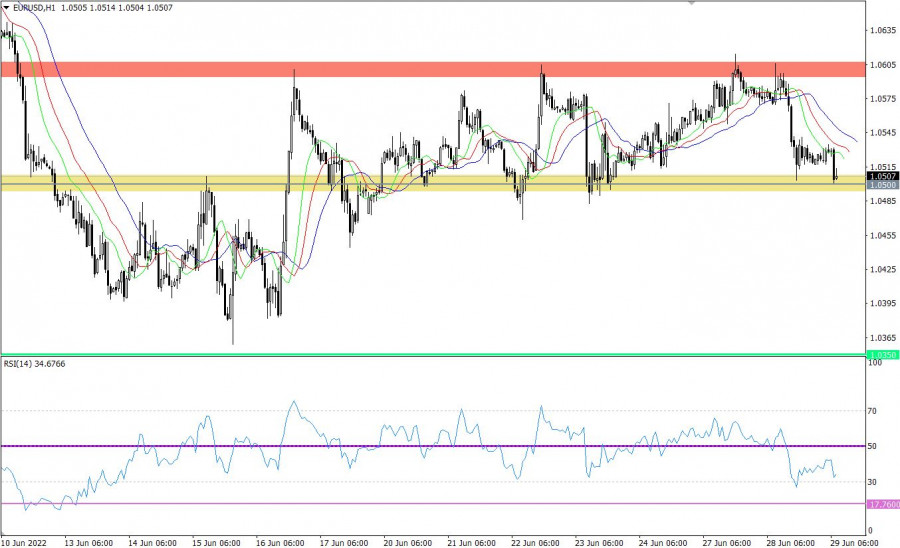
The EURUSD currency pair has been moving within the horizontal channel at 1.0500/1.0600 for the second week, where market participants managed to bounce off its upper limit during the past day. This movement led to a weakening of the euro exchange rate in the direction of the lower limit – 1.0500, where due to a natural basis, there was a reduction in the volume of short positions.

The RSI technical instrument in periods H1 and H4 moves in the lower area of the 30/50 indicator, which corresponds to the price movement within the lower border of the flat. RSI D1 also follows in the lower area of the 30/50 indicator, which corresponds to a downward trend in the medium-term interval.

The Alligator H1 and H4 indicator has many intersections between the MA moving lines, which indicates a flat. At the moment, the indicator lines are directed downwards. Alligator D1 is in a downtrend cycle, MA moving lines are pointing down.

This image is no longer relevant

Expectations and prospects

The scenario of the breakthrough of the lower border of the flat will be relevant only after the price stays below the level of 1.0500 in the daily period. Until then, the risk of a price rebound towards the upper border remains.

Complex indicator analysis has a sell signal in the short-term and intraday periods due to price movement within the lower border of the flat. Indicators in the medium term are focused on the main downward trend.

Dean Leo,
الخبير التحليلي لدى شركة إنستافوركس
© 2007-2024
كسب عائد من تغيرات أسعار العملات المشفرة مع إنستافوركس.
قم بتحميل منصة التداول ميتاتريدر 4 وافتح أول صفقة.
  • Grand Choice
    Contest by
    InstaForex
    InstaForex always strives to help you
    fulfill your biggest dreams.
    انضم إلى المسابقة
  • إيداع الحظ
    قم بإيداع 3,000 دولار في حسابك واحصل على $10,000 وأكثر من ذالك!
    في ديسمبر نحن نقدم باليانصيب $10,000 ضمن حملة إيداع الحظ!
    احصل على فرصة للفوز من خلال إيداع 3,000 دولار في حساب تداول. بعد أن استوفيت هذا الشرط، تصبح مشاركًا في الحملة.
    انضم إلى المسابقة
  • تداول بحكمة، اربح جهازا
    قم بتعبئة حسابك بمبلغ لا يقل عن 500 دولار ، واشترك في المسابقة ، واحصل على فرصة للفوز بأجهزة الجوال.
    انضم إلى المسابقة
  • بونص 100٪
    فرصتك الفريدة للحصول على بونص 100٪ على إيداعك
    احصل على بونص
  • بونص 55٪
    تقدم بطلب للحصول على بونص 55٪ على كل إيداع
    احصل على بونص
  • بونص 30٪
    احصل على بونص 30٪ في كل مرة تقوم فيها بتعبئة حسابك
    احصل على بونص

المقالات الموصى بها

لا تستطيع التحدث الآن؟
اطرح سؤالك في الدردشة.
Widget callback