EUR/USD
Analysis:
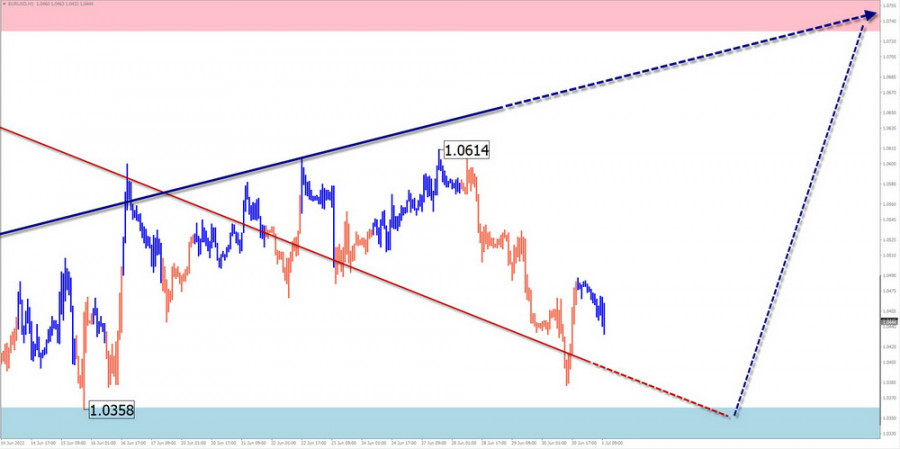
The primary euro pair's chart shows that the negative trend that has dominated over the past 1.5 years is still present. Price has climbed to the top of a huge TF's significant potential reversal zone. Price movements have primarily followed the side plane since mid-May, producing a correction of the wave's last segment.
Forecast:
The general sideways price movement pattern is anticipated to continue the following week. Pressure on the support zone is likely to start the week. Following that, watch for the development of a reversal and the continuation of the upward travel vector.
Potential zones for reversals
Resistance:
- 1.0730/1.0780
Support:
- 1.0360/1.0310
Recommendations:
In distinct sessions for the upcoming week, trading with a fractional lot may be successful on the euro market. Sales are subject to no conditions. To purchase the instrument in the support area, it is advised to keep an eye out for new signals.
USD/JPY
Analysis:
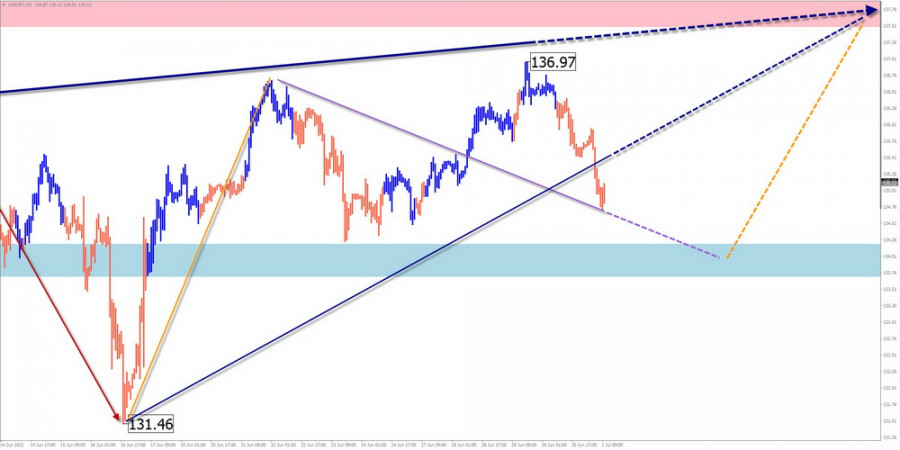
The key pair's market for the Japanese yen was set on an upward trend, which drove quotes to levels last seen 20 years ago. Price has nearly reached a large resistance zone's lower limit. Since June 16, the wave's incomplete portion has been keeping score. The stretched plane-shaped corrective component of the wave is nearly finished within its boundaries.
Forecast:
The bearish movement vector's conclusion is anticipated at the start of the upcoming week. Then you can wait for the formation of a reversal in the settlement support area. By the end of the week, the upward course is more likely to resume.
Potential zones for reversals
Resistance:
- 137.50/138.00
Support:
- 134.20/133.70
Recommendations:
There won't be any restrictions on trading Japanese yen on the pair's market in the upcoming days. It is advised to hold off on making any purchases until the purchase signals that your car has confirmed appear in the support zone.
GBP/JPY
Analysis:
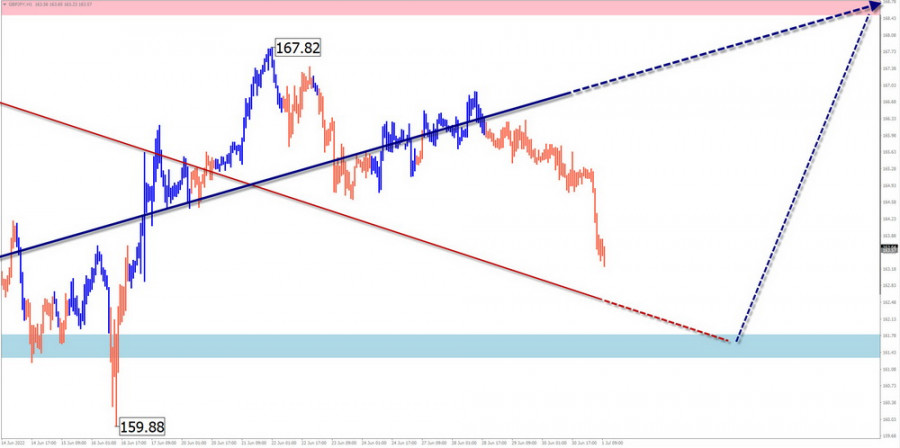
The pound/yen pair is moving at a rate pointed "north" of the price chart. A two-year trend supports this pattern. Price has surpassed the intermediate resistance's bottom boundary. Since May 12, the wave's incomplete portion has been keeping score. Its structure develops a flat adjustment for the present month. The movement is now in its latter stage.
Forecast:
We can anticipate a downward movement vector at the start of the upcoming weekly period until the correction waves are finished. The price of the pair is then waiting for a turn around and to resume moving upward. It seems improbable that the move would exceed its predicted range in the upcoming week.
Potential zones for reversals
Resistance:
- 168.50/169.00
Support:
- 161.80/161.30
Recommendations:
Within the framework of individual sessions with a smaller lot, sales of the pair in the upcoming days can result in a profit. It is recommended to complete the transaction at the first signal of a reversal. Before making an instrument purchase, it is advised to keep an eye out for new indications in the settlement support sector.
USD/CAD
Analysis:
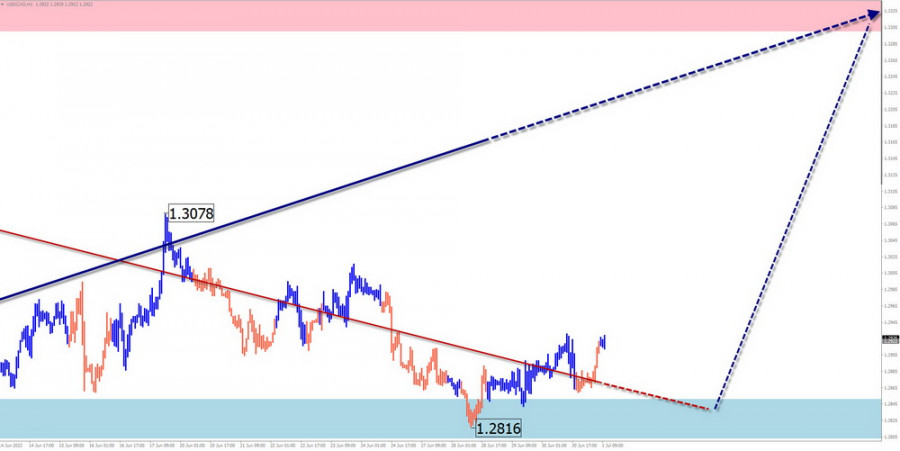
Since May last year, the primary pair's price movement for the Canadian dollar has been upward trending. The chart's weekly scale, which highlights this movement's corrective nature, may be seen. The incomplete segment began on June 7. The price has mostly been moving sideways during the past two weeks, generating the correction section (B) in the shape of a stretched plane.
Forecast:
It is anticipated that the flat mood will persist until the first part of next week and that the corrective structure will completely end. We anticipate that the reversal will be finished by the week's end and that the upward movement rate will resume. With the introduction of significant news blocks, there is a high likelihood of volatility growth.
Potential zones for reversals
Resistance:
- 1.3290/1.3340
Support:
- 1.2850/1.2800
Recommendations:
It is not advised to sell on the Canadian dollar market because it can be dangerous. Holding off on trading a pair is best until solid buy signals manifest themselves in the support region.
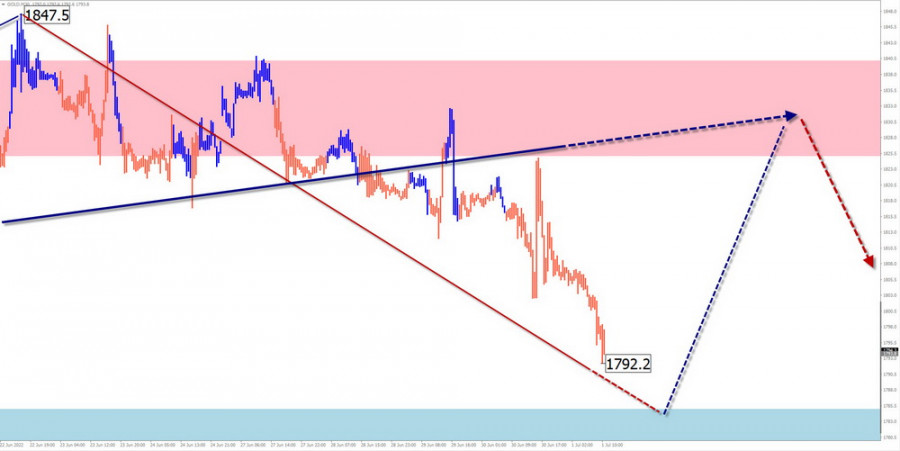
GOLD
Analysis:
On the gold market, the instrument is still in its downward trend, which began in early March. In the past month and a half, a corrective shifting plane that is yet unfinished has been forming in the wave structure. There is a gap in the final climbing segment.
Forecast:
We may anticipate a downward price movement at the start of this week, continuing until the decline phase is fully completed. In the field of settlement support, a reversal is probable. There is a good chance that the price of gold will rise quickly before the end of the week, reaching resistance levels. The downturn will then pick back up.
Potential zones for reversals
Resistance:
- 1825.0/1840.0
Support:
- 1785.0/1770.0
Recommendations:
After the current correction is over in its entirety, conditions for the sale of gold will be established. Before that, counter price increases can thwart any attempts. It is best to avoid buying instruments until the sale signals that your vehicle has confirmed shows in the resistance zone area.
Reasons: In the simple wave analysis (UVA), each wave has three components (A-B-C). Only the final and incomplete wave for each TF is examined. The arrows' solid backgrounds display the formed structure, while their dotty backgrounds display the anticipated movements.
Be aware that the wave algorithm does not account for how long the instruments' movements in time last!


