empty
 
 
21.07.2022 12:22 PM
Trading tips for novice traders in EUR/USD and GBP/USD on July 21

Details of the economic calendar last July 20

Inflation in the UK is at a new 40-year high, which exacerbates the already difficult economic situation in the country. Consumer prices rose 9.4% year-on-year in June, the highest since 1982. There is a signal that at the upcoming meeting, the Bank of England will be forced to sharply raise interest rates.

Analysis of the trading charts on July 20

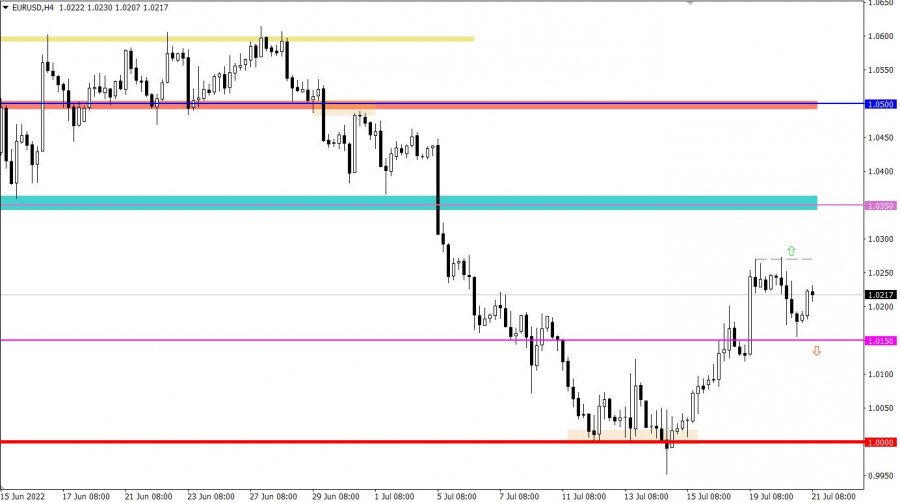
EUR/USD completed its consolidation at 1.0220/1.0270 by breaking its lower border, which resulted in a local downward movement towards the previously passed support level of 1.0150.

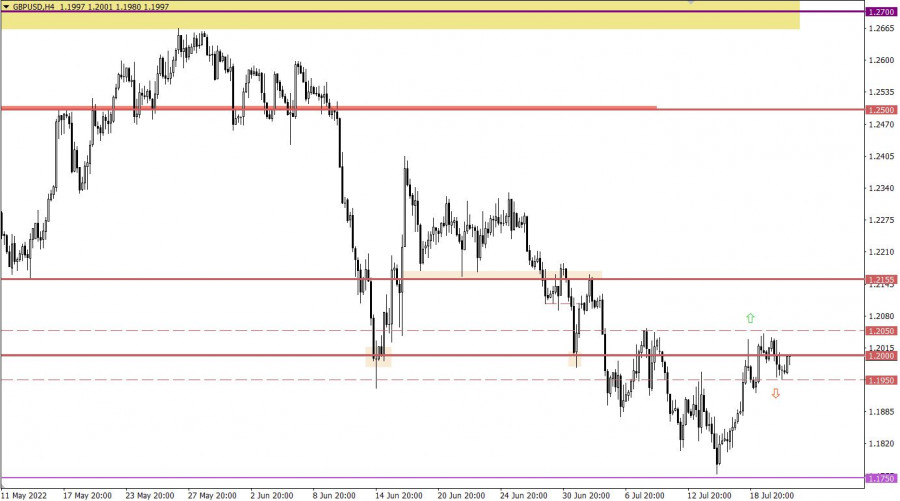
Meanwhile, GBP/USD's correction slowed down within the area of the psychological level of 1.2000, resulting in an amplitude of 1.1950/1.2050, which indicates the process of accumulation of trading forces. This can lead to new price jumps in the pair.

This image is no longer relevant

Economic calendar for July 21

The key event this week is the meeting of the ECB, where rates could increase for the first time in 11 years. Analysts expect a 0.25% rise, which is good, but very little. A local reaction may occur, but quotes will return to their previous values. If the rate hike is above expectations, or the ECB hints at a more aggressive strategy, an uptrend may happen in EUR/USD.

And even though the US is also releasing a report on jobless claims, which is predicted to show a slight increase, it will be ignored because markets will focus more on the results of the ECB meeting.

Schedule:

Results of the ECB meeting - 08:15 ET

Release of US jobless claims report - 3:30 PM ET

ECB press conference - 08:45 ET

Trading idea for EUR/USD on July 21

The pair will move today depending on the results of the ECB meeting.

Based on technical analysis, it is likely that holding the price below 1.0150 will ramp up short positions, while holding the price above 1.0280 will trigger another correction.

This image is no longer relevant

Trading idea for GBP/USD on July 21

Breaking through 1.1950/1.2050 is the best move considering the current situation. In the H4 TF, buy if the price is above 1.2060, while sell if the price is below 1.1920.

This image is no longer relevant

What is shown on the trading charts?

This candlestick chart has white and black graphic rectangles, with lines at the top and bottom. Detailed analysis of each candle will show characteristics relative to a particular time period, such as opening price, closing price, maximum and minimum price.

Horizontal levels are price coordinates, relative to which a stop or price reversal may occur. In the market, these levels are called support and resistance.

Circles and rectangles are highlighted examples of where the price reversed before. They indicate horizontal lines that may put pressure on the pair in the future. The up/down arrows are reference points of where the pair could go in the future.

Gven Podolsky,
الخبير التحليلي لدى شركة إنستافوركس
© 2007-2024
كسب عائد من تغيرات أسعار العملات المشفرة مع إنستافوركس.
قم بتحميل منصة التداول ميتاتريدر 4 وافتح أول صفقة.
  • Grand Choice
    Contest by
    InstaForex
    InstaForex always strives to help you
    fulfill your biggest dreams.
    انضم إلى المسابقة
  • إيداع الحظ
    قم بإيداع 3,000 دولار في حسابك واحصل على $3,000 وأكثر من ذالك!
    في نوفمبر نحن نقدم باليانصيب $3,000 ضمن حملة إيداع الحظ!
    احصل على فرصة للفوز من خلال إيداع 3,000 دولار في حساب تداول. بعد أن استوفيت هذا الشرط، تصبح مشاركًا في الحملة.
    انضم إلى المسابقة
  • تداول بحكمة، اربح جهازا
    قم بتعبئة حسابك بمبلغ لا يقل عن 500 دولار ، واشترك في المسابقة ، واحصل على فرصة للفوز بأجهزة الجوال.
    انضم إلى المسابقة
  • بونص 100٪
    فرصتك الفريدة للحصول على بونص 100٪ على إيداعك
    احصل على بونص
  • بونص 55٪
    تقدم بطلب للحصول على بونص 55٪ على كل إيداع
    احصل على بونص
  • بونص 30٪
    احصل على بونص 30٪ في كل مرة تقوم فيها بتعبئة حسابك
    احصل على بونص

المقالات الموصى بها

لا تستطيع التحدث الآن؟
اطرح سؤالك في الدردشة.
Widget callback