empty
27.04.2023 11:29 PM
Technical analysis of EUR/USD for April 27, 2023

This image is no longer relevant

Overview :

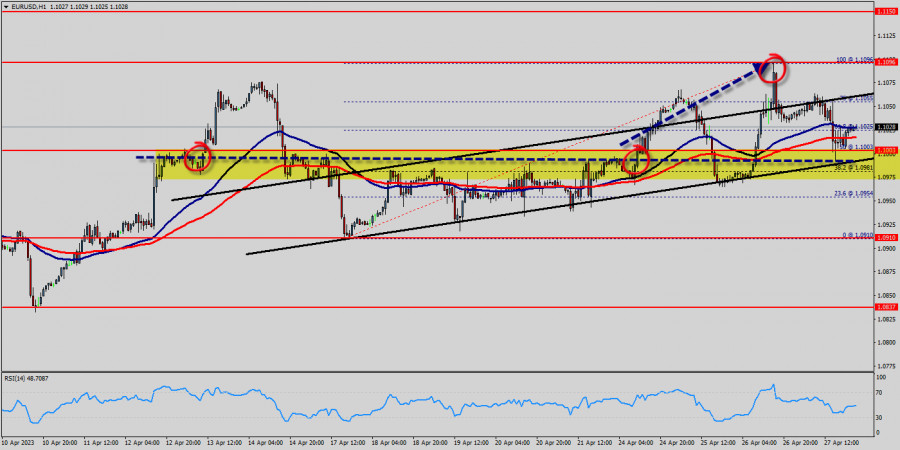
The EUR/USD pair continues to move upwards from the level of 1.1003. Today, the first support level is currently seen at 1.0910, the price is moving in a bullish channel now. Furthermore, the price has been set above the strong support at the level of 1.0910, which coincides with the 0% Fibonacci retracement level - double bottom - last bearish wave.

This support has been rejected three times confirming the veracity of an uptrend.

According to the previous events, we expect the EUR/USD pair to trade between 1.0910 and 1.0954.

Yesterday, the pair rose from the level of 1.0910 to 1.1003 which coincides with a ratio of 50% Fibonacci on the daily chart. Today, resistance is seen at the levels of 1.1096 and 1.1150.

We expect the price to set above the strong support at the levels of 1.0910 and 1.1003; because the price is in a bearish channel now. The RSI starts signaling an upward trend. Consequently, the market is likely to show signs of a bullish trend.

So, the support stands at 1.0910, while daily resistance is found at 1.1096. Therefore, the market is likely to show signs of a bullish trend around the spot of 1.1003.

In other words, buy orders are recommended above the spot of 1.1003 with the first target at the level of 1.1096; and continue towards 1.1150.

However, if the EUR/USD pair fails to break through the resistance level of 1.1096 today, the market will decline further to 1.0910.

Weekly range between the levels of 1.0910 - 1.1150.

It should be noted that volatility is very high for that the EUR/USD pair is still moving between 1.0910 and 1.1150 in coming hours.

Mourad El Keddani,
الخبير التحليلي لدى شركة إنستافوركس
© 2007-2025
Summary
Urgency
Analytic
Mourad El Keddani
Start trade
كسب عائد من تغيرات أسعار العملات المشفرة مع إنستافوركس.
قم بتحميل منصة التداول ميتاتريدر 4 وافتح أول صفقة.
  • Grand Choice
    Contest by
    InstaForex
    InstaForex always strives to help you
    fulfill your biggest dreams.
    انضم إلى المسابقة

المقالات الموصى بها

إذا تمكن زوج USD/JPY من اختراق مستوى المحور بنجاح، فإنه يمتلك القدرة على مواصلة التعزيز. الاثنين، 11 أغسطس 2025.

[USD/JPY] – [الاثنين، 11 أغسطس 2025] على الرغم من أن حالة USD/JPY لا تزال تتحرك بشكل جانبي، كما تشير المتوسطات المتحركة المتداخلة، فإن اختراق USD/JPY الناجح وإغلاقه فوق مستوى المحور

Arief Makmur 07:37 2025-08-11 UTC+2

لا يزال زوج NZD/USD لديه الفرصة لمواصلة تعزيز قوته إلى مستوى المقاومة الأقرب. الاثنين، 11 أغسطس 2025.

[NZD/USD] – [الاثنين، 11 أغسطس 2025] مع تشكيل كل من المتوسطات المتحركة الأسية (EMAs) تقاطعًا ذهبيًا ومؤشر القوة النسبية (RSI(14)) عند مستوى محايد صاعد، فإن الدولار النيوزيلندي لديه القدرة

Arief Makmur 07:37 2025-08-11 UTC+2

توقعات EUR/USD ليوم 11 أغسطس 2025

استقر اليورو بشكل أكثر ثباتًا عند مستوى الدعم 1.1632. وكلما طالت فترة استقراره هناك، أصبحت احتمالات النمو والانخفاض أكثر توازنًا. ومع ذلك، هناك عاملان يؤثران على هذه البنية المحايدة ويزيدان

Laurie Bailey 05:01 2025-08-11 UTC+2

توقعات GBP/USD ليوم 11 أغسطس 2025

الجنيه الإسترليني يستقر عند ارتفاعه الذي وصل إليه مؤخرًا، عند مستوى النمو قصير الأجل البالغ 1.3452. كسر قوي فوق هذا المستوى سيفتح الطريق إلى مستوى وسيط آخر عند 1.3525،

Laurie Bailey 05:01 2025-08-11 UTC+2

توقعات AUD/USD ليوم 11 أغسطس 2025

وصل الدولار الأسترالي إلى خط مؤشر التوازن اليومي وبدأ في التماسك. في الوقت نفسه، انتقل مذبذب مارلين إلى المنطقة الإيجابية وبدأ أيضًا في التماسك. تتشكل الظروف لاختراق صعودي مع هجوم

Laurie Bailey 05:01 2025-08-11 UTC+2

إشارات التداول للذهب (XAU/USD) للفترة من 8 إلى 11 أغسطس 2025: البيع تحت مستوى 3,407 دولار (21 SMA - 7/8 Murray)

إذا استأنف الذهب دورته الصعودية في الساعات القادمة وارتد فوق 3,382، فسيُعتبر ذلك فرصة لمواصلة الشراء بهدف الوصول إلى 3,398. قد يصل الأداة في النهاية إلى مستوى 8/8 Murray

Dimitrios Zappas 17:27 2025-08-08 UTC+2

إشارات التداول لعملة البيتكوين للفترة من 8 إلى 11 أغسطس 2025: البيع تحت مستوى $117,800 (200 EMA - 21 SMA)

قد يؤدي الانخفاض إلى ما دون 115,000 دولار إلى إحياء الدورة الهبوطية. لذلك، نتوقع أن يصل سعر BTC إلى 4/8 من Murray عند 112,500 دولار، وفي النهاية يصل إلى المستوى

Dimitrios Zappas 17:25 2025-08-08 UTC+2

تحليل وتوقعات الدولار الأمريكي/الين الياباني

من الناحية الفنية، تظل الأسعار الفورية ضمن نطاق التداول الأسبوعي. ومع ذلك، من المبكر تأكيد تكامل هبوطي كامل، حيث تظل المؤشرات على الرسم البياني اليومي في المنطقة الإيجابية. يمكن

Irina Yanina 13:58 2025-08-08 UTC+2

التوقعات لليورو/الدولار الأمريكي في 8 أغسطس 2025

يوم الخميس، ارتفع زوج اليورو/الدولار الأمريكي من مستوى تصحيح 76.4% عند 1.1695، وانعكس لصالح الدولار الأمريكي، وانخفض إلى ما دون منطقة الدعم 1.1637–1.1645. اليوم، قد يستمر الانخفاض نحو مستوى فيبوناتشي

Samir Klishi 11:10 2025-08-08 UTC+2

GBP/USD. 8 أغسطس. قرار بنك إنجلترا يترك الجنيه دون تأثير كبير

في الرسم البياني لكل ساعة، واصل زوج الجنيه الإسترليني/الدولار الأمريكي الارتفاع يوم الخميس، حيث استقر فوق منطقة المقاومة 1.3357–1.3371 ومستوى 1.3425. وبالتالي، قد يستمر الاتجاه الصعودي يوم الجمعة نحو مستويات

Samir Klishi 11:02 2025-08-08 UTC+2
لا تستطيع التحدث الآن؟
اطرح سؤالك في الدردشة.
Widget callback
 

Dear visitor,

Your IP address shows that you are currently located in the USA. If you are a resident of the United States, you are prohibited from using the services of InstaFintech Group including online trading, online transfers, deposit/withdrawal of funds, etc.

If you think you are seeing this message by mistake and your location is not the US, kindly proceed to the website. Otherwise, you must leave the website in order to comply with government restrictions.

Why does your IP address show your location as the USA?

  • - you are using a VPN provided by a hosting company based in the United States;
  • - your IP does not have proper WHOIS records;
  • - an error occurred in the WHOIS geolocation database.

Please confirm whether you are a US resident or not by clicking the relevant button below. If you choose the wrong option, being a US resident, you will not be able to open an account with InstaForex anyway.

We are sorry for any inconvenience caused by this message.