Details of the economic calendar for October 4
Producer prices in the EU accelerated more than expected, from 38.0% to 43.3%, that is, these data indicate that the limit of inflation growth in the eurozone has not yet been reached. Thus, the ECB has plenty of incentive to further tighten monetary policy. In this case, interest rates will continue to rise, which may support the European currency.
During the American trading session, data on the Job Openings and Labor Turnover Survey (JOLTS) in the United States were published, where negative indicators for the labor market are recorded. The number of vacancies in the US in August hit a 14-month low, falling by 1.8 million from a record high in March. This is a characteristic call for the Fed that the labor market is under threat. All this may lead to a slowdown in the pace of rate increases, waiting for the ADP report and the report of the US Department of Labor.
Analysis of trading charts from October 4
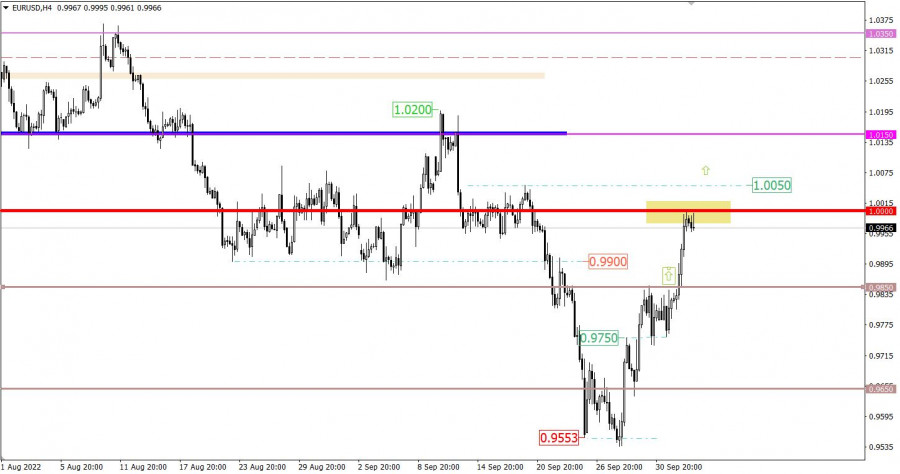
The EURUSD currency pair accelerated its upward movement, as a result of which the quote reached the expected parity level (1.0000). The scale of the euro's strengthening from the local low of the downward trend amounted to a little more than 450 points.
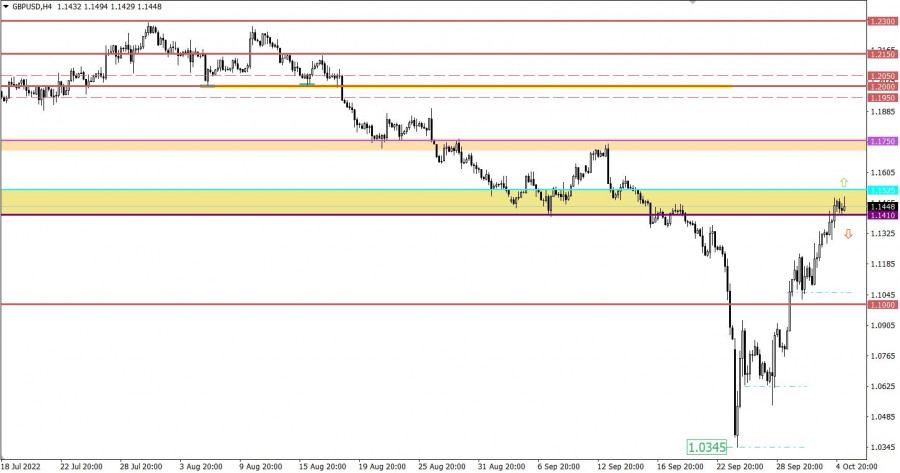
The GBPUSD currency pair has overcome the resistance level of 1.1410 during a rapid corrective movement from the local low of the downward trend. The move indicates a strong desire by speculators to continue rising despite the fact that the pound sterling has already gained more than 1,100 points in the 7 trading day period.
Economic calendar for October 5
Today, business activity data in the services sector and the composite index in Europe, the United Kingdom, and the United States are expected. It should be taken into account that these are the final data, and if they coincide or practically coincide with the preliminary estimate, then the reaction on the market should not be expected.
During the American trading session, in addition to the PMI index, the ADP report on employment in the United States will be published, which may rise by 200,000.
The ADP report is often viewed by traders as a leading indicator of the US Department of Labor report.
Time targeting:
EU Services PMI (Sept) – 08:00 UTC
UK Services PMI (Sep) – 08:30 UTC
ADP report – 12:15 UTC
US Services PMI (Sep) – 13:45 UTC
Trading plan for EUR/USD on October 5
At the moment, parity is considered by traders as a strong resistance level. Thus, a price rebound scenario is allowed, which will lead to a partial recovery of dollar positions relative to the recent correction.
The upward cycle prolongation scenario will be used if the price holds above 1.0050 in a four-hour period.
Trading plan for GBP/USD on October 5
In this situation, there is an overheating of long positions on the pound, which fully allows for a scenario of stagnation or pullback. In this case, the return of the price below 1.1400 may temporarily weaken the exchange rate of the British currency, strengthening short positions on it.
At the same time, there is still speculative interest in the market, which allows a prolongation of the correction if the quote overcomes 1.1525. Under this scenario, the subsequent growth of the pound sterling towards the level of 1.1750 is possible.
What is shown in the trading charts?
A candlestick chart view is graphical rectangles of white and black light, with sticks on top and bottom. When analyzing each candle in detail, you will see its characteristics of a relative period: the opening price, closing price, and maximum and minimum prices.
Horizontal levels are price coordinates, relative to which a stop or a price reversal may occur. These levels are called support and resistance in the market.
Circles and rectangles are highlighted examples where the price of the story unfolded. This color selection indicates horizontal lines that may put pressure on the quote in the future.
The up/down arrows are the reference points of the possible price direction in the future.


