Analysis of EUR/USD, 5-minute chart

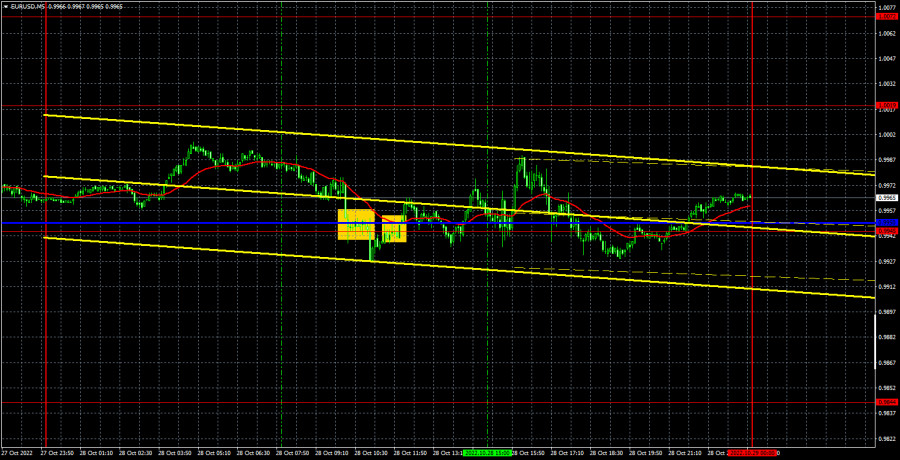
On Friday, the euro/dollar pair was sliding, but then, managed to settle above the critical line, which is very important under the current conditions. For the first time in a long period, the euro has a chance to form an upward cycle. That is why it needs to keep all technical conditions for a rise. However, there are a lot of obstacles. Firstly, the currency is still trading near its 20-year lows and shows a tepid intention to increase. Secondly, this week, the Fed is going to hold a meeting. It is highly likely to raise the key interest rate by 0.75%. Thus, the US dollar should also rise. Thirdly, fundamental and geopolitical conditions will hardly favor the euro. That is why it has every chance to decline. Nevertheless, there are no clear sell signals. What is more, today, the eurozone is going to disclose important reports. In this light, the new trading week is expected to be active. We should also remember that the price is above the trend line. On Friday, the situation with trading signals was not very good. The pair was trading mainly sideways, which led to numerous false signals, which were formed near 0.9945-0.9950. In the chart above, we marked only the first two signals that traders might have taken into account. However, both trades led to losses as it was impossible to set a stop loss.
COT report
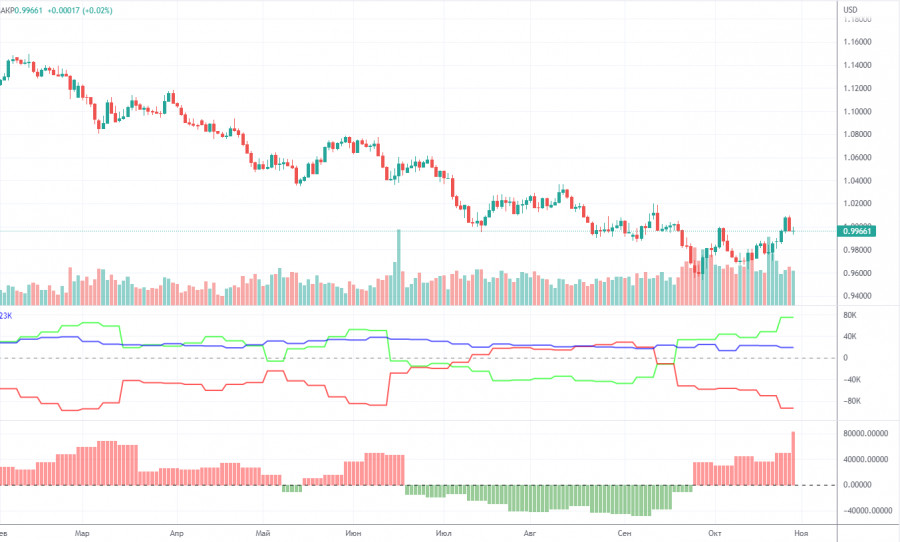
In 2022, the COT reports for the euro are becoming more and more interesting. In the first part of the year, the reports were pointing to the bullish sentiment among professional traders. However, the euro was confidently losing value. Then, for several months, reports were reflecting bearish sentiment and the euro was also falling. Now, the net position of non-commercial traders is bullish again. The euro managed to rise above its 20-year low, adding 500 pips. This could be explained by the high demand for the US dollar amid the difficult geopolitical situation in the world. Even if demand for the euro is rising, high demand for the greenback prevents the euro from growing.
In the given period, the number of short orders initiated by non-commercial traders increased by 24,000, whereas the number of long orders declined by 2,700. As a result, the net position increased by 26,700 contracts. However, this could hardly affect the situation since the euro is still at the bottom. At the moment, professional traders still prefer the greenback to the euro. The number of buy orders exceeds the number of sell orders by 75,000. However, the euro cannot benefit from the situation. Thus, the net position of non-commercial traders may go on rising without changing the market situation. Among all categories of traders, the number of long positions exceeds the number of short positions by 19,000 (609,000 against 590,000).
Analysis of EUR/USD, 1-hour chart
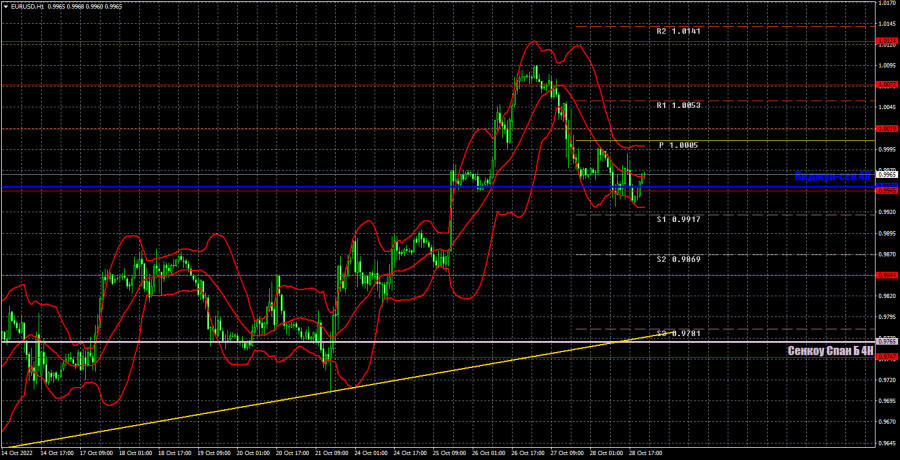
On the one-hour chart, the pair is moving upwards. However, a lot may change this week. At the moment, the price is above the Kijun-sen line, but it may slide below it today. On the daily chart, the pair failed to consolidate above the Senkou Span B line, which is capping its upward potential. On Monday, the pair may trade at the following levels: 0.9635, 0.9747, 0.9844, 0.9945, 1.0019, 1.0072, 1.0124, 1.0195, 1.0269, as well as the Senkou Span B (0.9765) and Kijun-sen (0.9950) lines.
Lines of the Ichimoku indicator may move during the day, which should be taken into account when determining trading signals. There are also support and resistance levels, but signals are not formed near these levels. Bounces and breakouts of the extreme levels and lines could act as signals. Don't forget about stop-loss orders, if the price covers 15 pips in the right direction. This will prevent you from losses in case of a false signal. On October 31, the eurozone is going to disclose its GDP data for the third quarter and inflation figures for October. Both reports are important and may lead to a significant movement in the price. What is more, traders may start pricing in the Fed meeting results in advance. That is why everyone should be ready for sharp price swings.
What we see on the trading charts:
Price levels of support and resistance are thick red lines, near which the movement may end. They do not provide trading signals.
The Kijun-sen and Senkou Span B lines are the lines of the Ichimoku indicator, moved to the one-hour chart from the 4-hour one. They are strong lines.
Extreme levels are thin red lines from which the price bounced earlier. They provide trading signals.
Yellow lines are trend lines, trend channels, and any other technical patterns.
Indicator 1 on the COT charts reflects the net position size of each category of traders.
Indicator 2 on the COT charts reflects the net position size for the non-commercial group.


