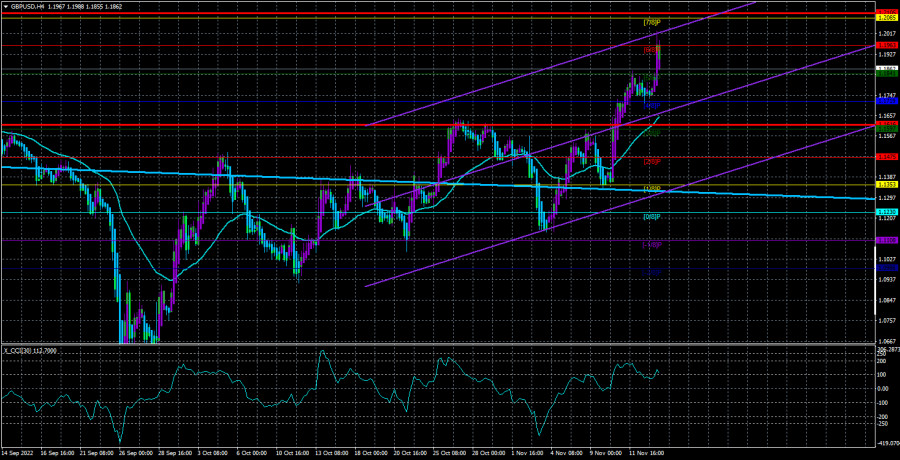
On Tuesday, GBP/USD skyrocketed. In fact, the rise was not triggered by either macro releases or fundamental factors. The unemployment rate grew. Average earnings increased slower than UK inflation. Therefore, both reports may be considered disappointing. Still, the market is now focusing on other factors.
The pound now shows growth similar to that of the greenback several months ago. Although we thought a prolonged downtrend would stop sooner or later, we did not expect such a strong and groundless uptrend. In recent months, the pound has seen a modest increase with frequent corrections occurring, according to the chart. Over the past two weeks, the sterling has swelled by 900 pips. As for events that have taken place over the same time period, we saw the Bank of England and the Fed raising interest rates by 0.75%. Moreover, the Fed's rate remains higher, and the prospects for the British economy, drawn by Andrew Bailey, should have shocked GBP bulls. Next, the chance of a reduction in the pace of the Fed's rate hikes increased post-US inflation. Meanwhile, inflation in the UK is still on the rise, and the pace of tightening may be reduced in December. The US may or may not enter a recession in the coming two years. At the same time, the UK is already suffering from a recession, according to the BoE governor. So, what is the reason behind the pound's bull run?
In our view, there is a sole logical explanation. Market participants are simply locking in profits on short positions, as they no longer expect a stronger dollar. Aggressive monetary tightening in the US is about to end, and USD buying volumes are declining. Still, a stronger pound is something else. Therefore, a bearish correction and prolonged consolidation may soon follow.
Jeremy Hunt: all Britons will pay higher taxes
We have talked about Liz Truss's tax initiatives on numerous occasions, but they are now history. Her plan to cut taxes was severely criticized in Parliament, as it could have created a £250 billion hole in the budget. Critics were most likely right. Only Truss wanted to be as close to the people as possible. At the same time, the UK's current PM, Rishi Sunak, who is a financer and the former finance minister, is likely to focus solely on the economy. Meanwhile, Britons who are now seeing higher prices in stores and at gas stations, not to mention utility bills, will also face higher taxes, instead of promised tax cuts.
Jeremy Hunt, the UK's new Chancellor of the Exchequer, who is due to present his fiscal plan tomorrow, said this week that Britons will have to pay more taxes. He also noted that households will get limited support to pay their electricity bills because the government needs to level the budget deficit of £50 billion. Hunt intends to cut government spending by £35 billion and increase tax revenues by £20 billion. The Labor Party has already criticized Hunt's initiative, saying it would be a burden for working people. The Chancellor of the Exchequer acknowledged that his tax plan would disappoint many. Therefore, Britons' reaction remains to be seen.
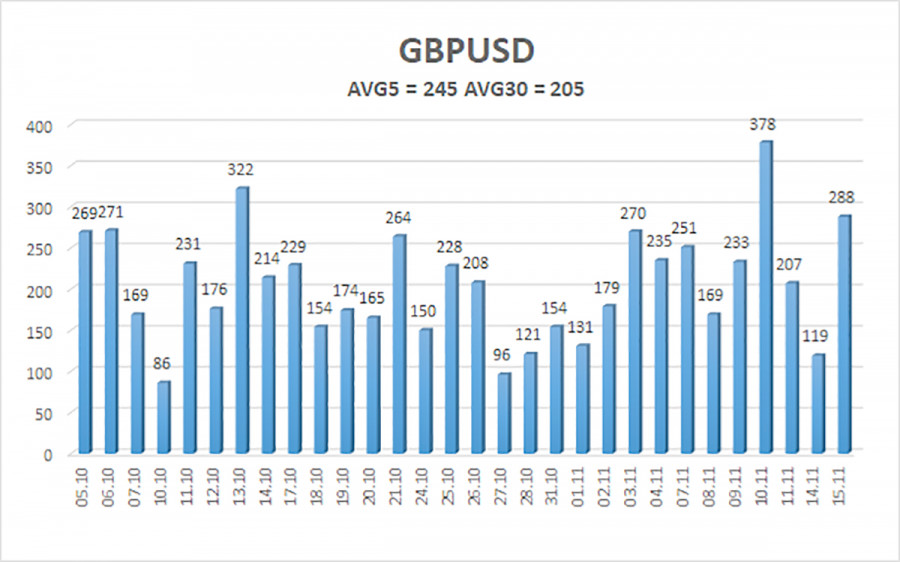
On November 16th, the 5-day average volatility of GBP/USD totals 245 pips and is evaluated as extremely high. On Wednesday, the pair is expected to move within a channel limited by the 1.1616 and 1.2105 levels. Heiken Ashi's downward reversal will mark the beginning of a correction.
Closest support levels:
S1 – 1.1841
S2 – 1.1719
S3 – 1.1597
Closest resistance levels:
R1 – 1.1963
R2 – 1.2085
R3 – 1.2207
Outlook:
The GBP/USD pair keeps moving north in the H4 time frame. So, long positions could be held with targets at 1.2085 and 1.2207 until Heiken Ashi reverses to the downside. Short positions could be considered after consolidation below the moving average with targets at 1.1475 and 1.1353.
Indicators on charts:
Linear Regression Channels help identify the current trend. If both channels move in the same direction, a trend is strong.
Moving Average (20-day, smoothed) defines the short-term and current trends.
Murray levels are target levels for trends and corrections.
Volatility levels (red lines) reflect a possible price channel the pair is likely to trade in within the day based on the current volatility indicators.
CCI indicator. When the indicator is in the oversold zone (below 250) or in the overbought area (above 250), it means that a trend reversal is likely to occur soon.


