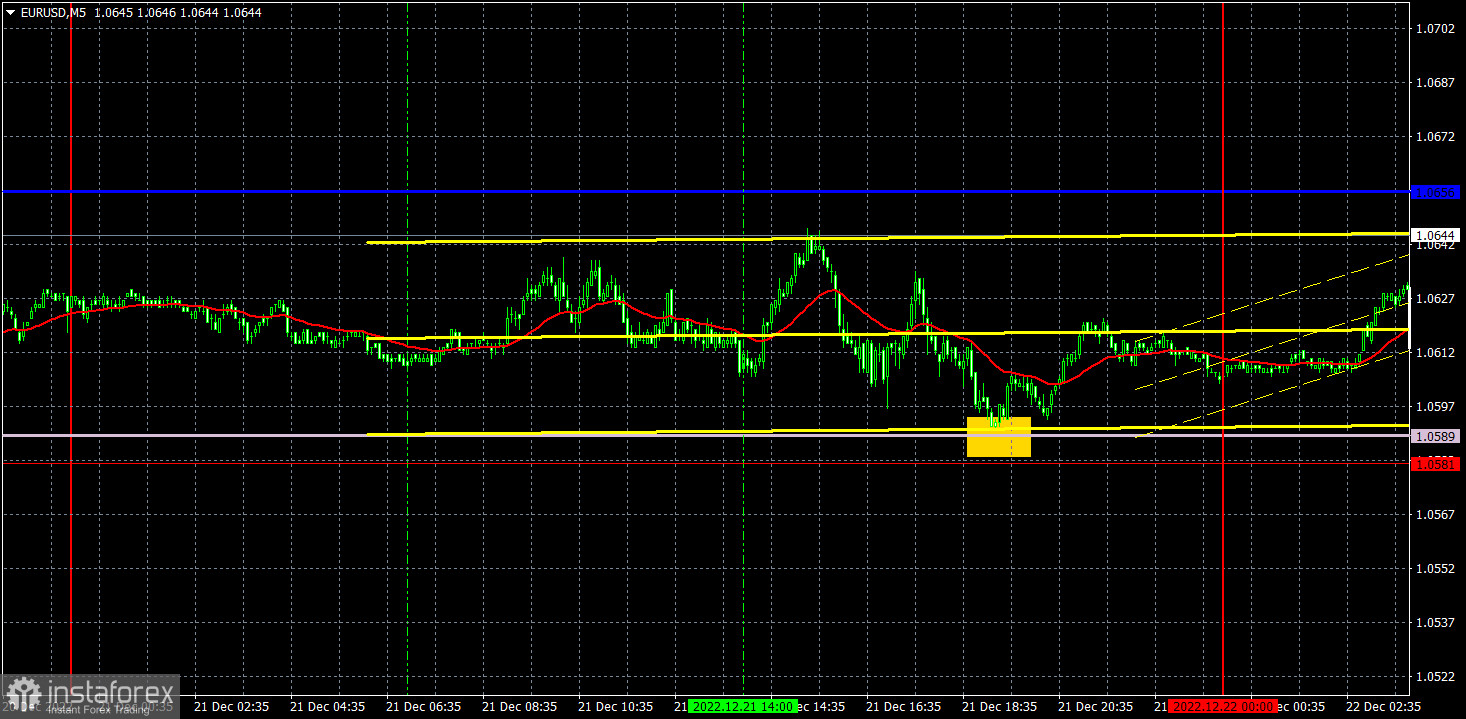
M5 chart of EUR/USD
EUR/USD is still trading within the 1.0581-1.0658 horizontal channel. In fact, this is a very good moment, as we have clear guidelines for the pair's movement, despite the fact that a flat was formed in the market. At least the pair does not form false signals, which leads to losses. However, there is nothing more to say about the technical pattern. The pair, ignoring the flat, is still in a high position and there is no bearish correction even after weeks of strong growth. However, the coming Christmas and New Year's holidays will cancel the desire to trade, so the flat might last for another week or two, or maybe even more. There were no important events or reports in the EU and the US on Wednesday. I still expect a bearish correction in the medium term, but at this time, a flat.
On Wednesday, EUR only approached the important line just once. It happened during the US trading session. It reached the Senkou Span B line with minimal error, so this rebound could be regarded as a buy signal. However, it was formed quite late, so it was not necessary to open a long position. Also, take note that the Senkou Span B line might converge with the Kijun-Sen in the near future, so I won't adjust just yet. These lines lose their strength in a flat.
COT report
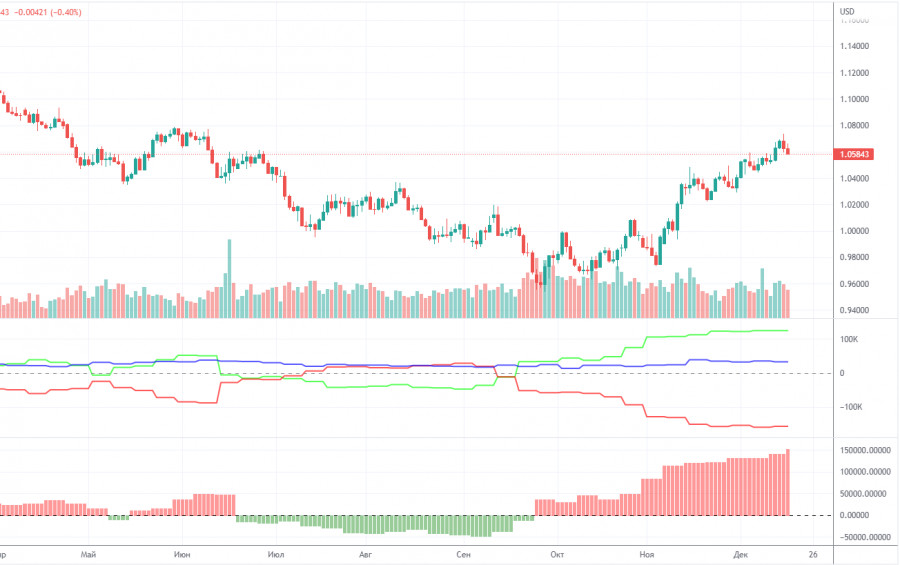
In 2022, the COT reports for the euro are becoming more and more interesting. In the first part of the year, the reports were pointing to the bullish sentiment among professional traders. However, the euro was confidently losing value. Then, for several months, reports were reflecting bearish sentiment and the euro was also falling. Now the net position of non-commercial traders is again bullish and strengthens almost every week. The euro is growing but a fairly high value of the net position may point to the end of the upward movement or at least, to a correction. During the given period, non-commercial traders opened 8,600 long positions, whereas the number of short positions rose by 8,500. Thus, the net positions fell by 100. Notably, the green and red lines of the first indicator have moved far apart from each other, which may mean the end of the ascending trend (which wasn't actually an uptrend because the upward movement of the last two and a half months fits under the "correction" category against the global downtrend). The number of long positions is 125,000 higher than the number of sell positions opened by non-commercial traders. Thus, the net position of the non-commercial group may continue to grow. However, the euro may remain unchanged. The overall number of short orders exceeds the number of long orders by 33,000 (711,000 vs. 678,000).
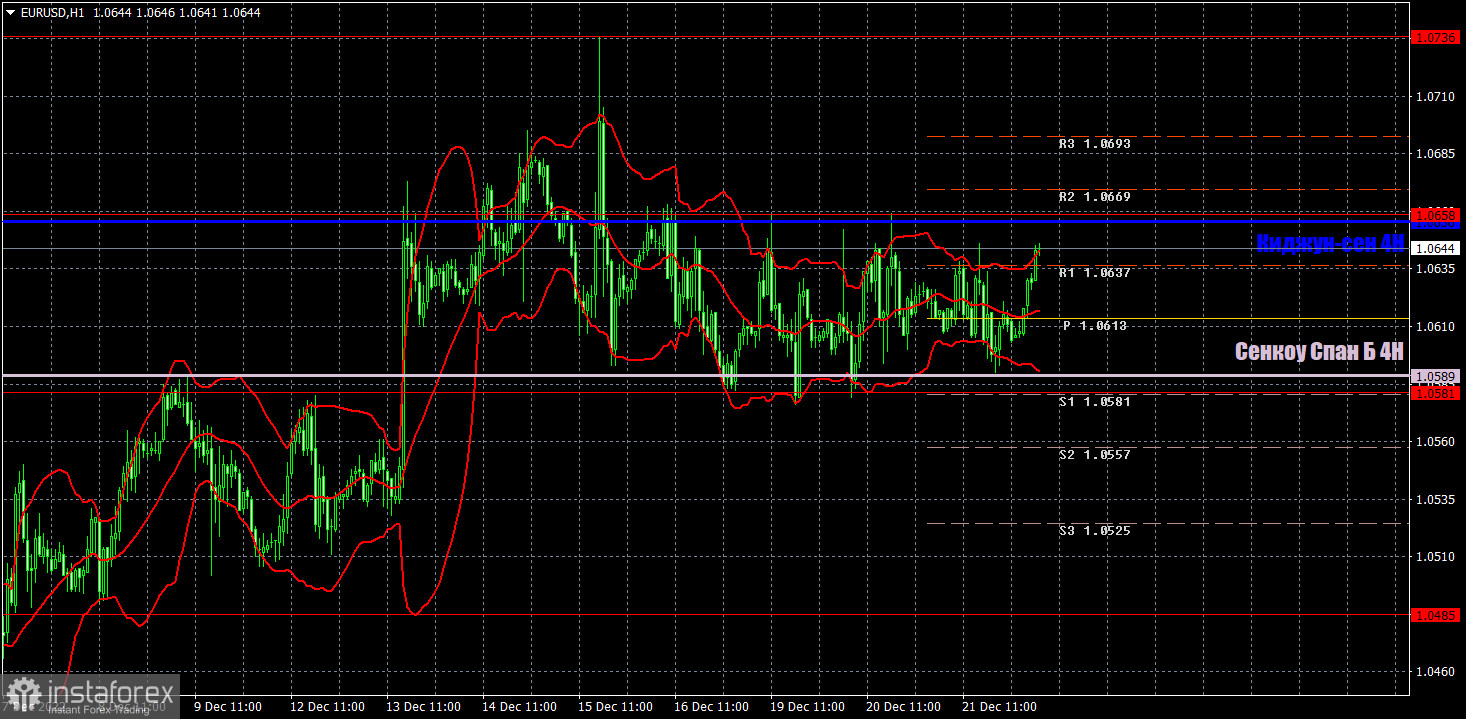
H1 chart of EUR/USD
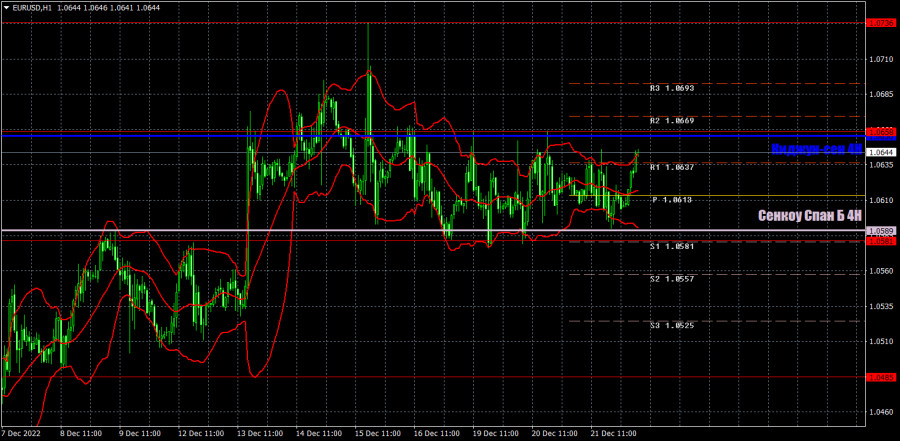
EUR/USD is still in a high position on the one-hour chart, although it has hardly settled below the critical line. So far, we're not sure whether it will continue to move down since there's already signs that the market is flat. Lines of the Ichimoku indicator may soon merge with each other and lose all meaning. We should now rely on the 1.0581-1.0658 horizontal channel. If EUR manages to go beyond it, then we can count on some trend movement. On Thursday, the pair may trade at the following levels: 1.0340-1.0366, 1.0485, 1.0581, 1.0658, 1.0736, 1.0806, as well as Senkou Span B (1.0589) and Kijun Sen (1.0656). Lines of the Ichimoku indicator may move during the day, which should be taken into account when determining trading signals. There are also support and resistance levels, but signals are not formed near these levels. Bounces and breakouts of the extreme levels and lines could act as signals. Don't forget about stop-loss orders, if the price covers 15 pips in the right direction. This will prevent you from losses in case of a false signal. There are no important reports or events scheduled for today in the EU. A not so important GDP report for the third quarter will be published in the US. But "every cloud has a silver lining", so let's not miss it.
What we see on the trading charts:
Price levels of support and resistance are thick red lines, near which the movement may end. They do not provide trading signals.
The Kijun-sen and Senkou Span B lines are the lines of the Ichimoku indicator, moved to the one-hour chart from the 4-hour one. They are strong lines.
Extreme levels are thin red lines from which the price bounced earlier. They provide trading signals.
Yellow lines are trend lines, trend channels, and any other technical patterns.
Indicator 1 on the COT charts reflects the net position size of each category of traders.
Indicator 2 on the COT charts reflects the net position size for the non-commercial group.