empty
03.01.2023 07:47 AM
Outlook and trading signals for GBP/USD on January 3. COT report. Analysis of market situation. The pound found no reason to move on Monday.

M5 chart of GBP/USD

This image is no longer relevant

GBP/USD continued to trade within the 1.2007-1.2106 horizontal channel on Monday. Thus, the technical picture remained the same, and volatility during the day was still low. Take note that the pair did not move at all during the entire US session. Literally, in the sense of the word. The holidays continue, and traders are not in a hurry to come back to the market. Therefore, this kind of movement shouldn't be surprising. No important reports published in Great Britain and the US. However, it doesn't matter now: in order for the pair to leave the flat, traders should be adamant to move. The flat might even persist until Friday, though some very important US data will be released on that day. Therefore, the pair can still be traded but only in the smallest time frames.

There was only one trading signal yesterday. If one of the traders moved in great haste, he/she could open a short position when the pair crossed the critical line. However, after an hour, the movement stopped, so the position could be closed at any time till the evening and you could even make a profit. But all in all, there were no movements yesterday.

COT report

This image is no longer relevant

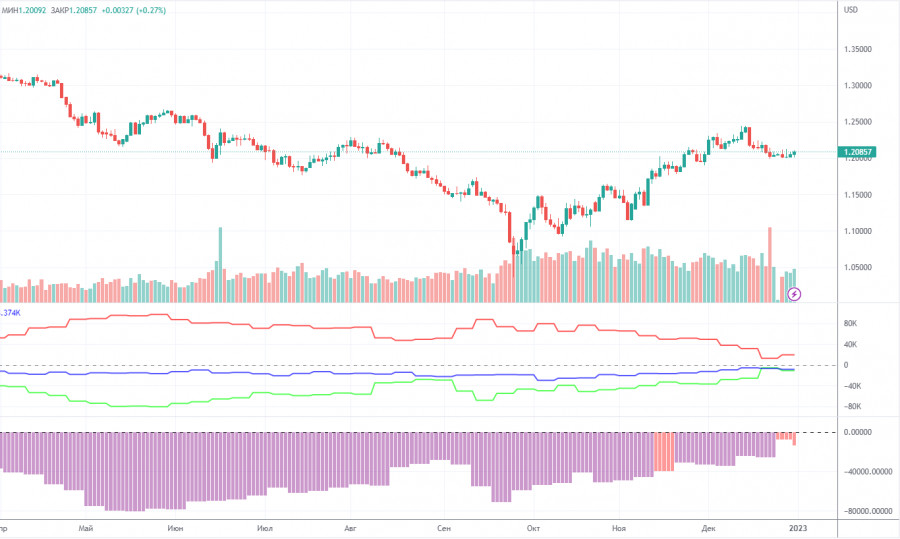
The latest COT report showed that bearish sentiment had weakened. During the given period, non-commercial traders opened 5,300 long positions and as many as 10,600 short positions. Thus, the net position fell by about 5,300. This figure has been on the rise for several months, and the sentiment may become bullish in the near future. Although the pound has grown against the dollar for the last few weeks, it is still difficult to answer why it keeps rising. On the other hand, it could fall in the near future (in the mid-term prospect) because it still needs a correction. In general, in recent months the COT reports correspond to the pound's movements so there shouldn't be any questions. Since the net position is not even bullish yet, buying may continue for a few months to come. Non-commercial traders now hold 40,600,000 long positions and 51,500 short ones. I am still skeptical about the pound's long term growth, though there are technical reasons for it. At the same time, fundamental and geopolitical factors signal that the currency is unlikely to strengthen significantly.

H1 chart of GBP/USD

This image is no longer relevant

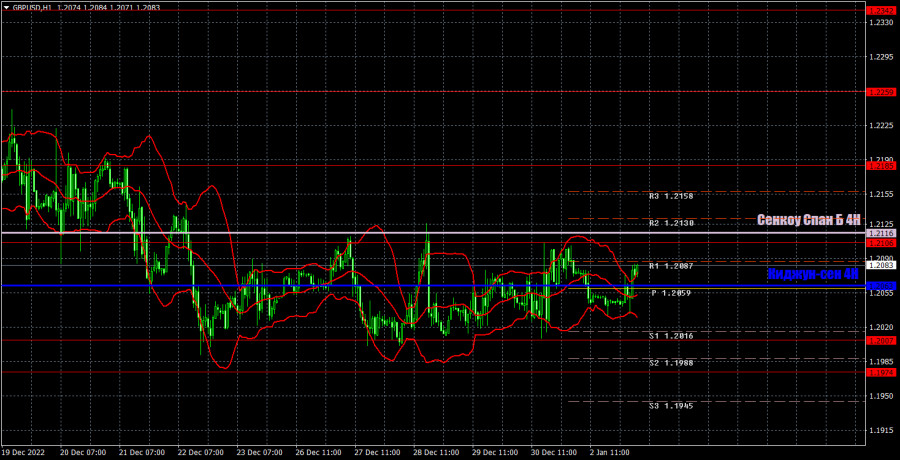
On the one-hour chart, GBP/USD is still in the horizontal channel. The lines of the Ichimoku indicator have already lost their strength because the pair can cross them 5 times a day when facing a flat. Now we have to wait for the flat to end or trade for a pullback from the limits of the horizontal channel. On January 3, the pair may trade at the following levels: 1.1760, 1.1874, 1.1974-1.2007, 1.2106, 1.2185, 1.2259. Senkou Span B (1.2216) and Kijun Sen (1.2063) lines may also generate signals. Pullbacks and breakouts through these lines may produce signals as well. A Stop Loss order should be set at the breakeven point after the price passes 20 pips in the right direction. Ichimoku indicator lines may move during the day, which should be taken into account when determining trading signals. In addition, the chart does illustrate support and resistance levels, which could be used to lock in profits. Today, the UK and the US are set to publish the manufacturing activity indices in the final estimates for December - absolutely minor reports. I believe that the flat may persist for a few more days at least.

What we see on the trading charts:

Price levels of support and resistance are thick red lines, near which the movement may end. They do not provide trading signals.

The Kijun-sen and Senkou Span B lines are the lines of the Ichimoku indicator, moved to the one-hour chart from the 4-hour one. They are strong lines.

Extreme levels are thin red lines from which the price bounced earlier. They provide trading signals.

Yellow lines are trend lines, trend channels, and any other technical patterns.

Indicator 1 on the COT charts reflects the net position size of each category of traders.

Indicator 2 on the COT charts reflects the net position size for the non-commercial group.

Paolo Greco,
الخبير التحليلي لدى شركة إنستافوركس
© 2007-2025
حدد الإطار الزمني
5
د
15
د
30
د
1
س
4
ساعات
1
يوم
1
أسبوع
كسب عائد من تغيرات أسعار العملات المشفرة مع إنستافوركس.
قم بتحميل منصة التداول ميتاتريدر 4 وافتح أول صفقة.
  • Grand Choice
    Contest by
    InstaForex
    InstaForex always strives to help you
    fulfill your biggest dreams.
    انضم إلى المسابقة

المقالات الموصى بها

GBP/USD: خطة التداول للجلسة الأمريكية في 21 مارس (مراجعة تداولات الصباح)

في توقعاتي الصباحية، ركزت على مستوى 1.2946 وخططت لاتخاذ قرارات التداول من تلك النقطة. دعونا نلقي نظرة على الرسم البياني لمدة 5 دقائق لنرى ما حدث. ارتفع السعر، لكنه

Miroslaw Bawulski 18:04 2025-03-21 UTC+2

EUR/USD: خطة التداول للجلسة الأمريكية في 21 مارس (مراجعة تداولات الصباح)

في توقعاتي الصباحية، قمت بتسليط الضوء على مستوى 1.0856 وخططت لاتخاذ قرارات التداول حوله. دعونا نلقي نظرة على الرسم البياني لمدة 5 دقائق ونرى ما حدث. ارتفع السعر، لكنه

Miroslaw Bawulski 17:59 2025-03-21 UTC+2

كيفية تداول زوج الجنيه الإسترليني/الدولار الأمريكي في 21 مارس؟ نصائح بسيطة وتحليل التداول للمبتدئين

أظهر زوج الجنيه الإسترليني/الدولار الأمريكي أيضًا حركة هبوطية يوم الخميس، لكن الجنيه ارتفع بثبات مساء الأربعاء - على عكس زوج اليورو/الدولار الأمريكي. مرارًا وتكرارًا، نرى الجنيه الإسترليني يظهر مرونة مثيرة

Paolo Greco 05:56 2025-03-21 UTC+2

كيفية تداول زوج اليورو/الدولار الأمريكي في 21 مارس؟ نصائح بسيطة وتحليل التداول للمبتدئين

انخفض زوج العملات اليورو/الدولار الأمريكي يوم الخميس بعد الإعلان عن نتائج اجتماع الاحتياطي الفيدرالي. أخيرًا، شهدنا بعض التعزيز للدولار الأمريكي، وأخيرًا، تفاعل السوق بشكل منطقي إلى حد ما. دعونا نتذكر

Paolo Greco 05:56 2025-03-21 UTC+2

توصيات وتحليل التداول لزوج الجنيه الإسترليني/الدولار الأمريكي في 21 مارس — الجنيه الإسترليني يواصل السخرية

واصل زوج العملات GBP/USD التداول يوم الخميس... من الصعب تحديد الاتجاه الذي يجب اتخاذه. لا يزال الاتجاه الصعودي قائمًا، لكن السعر كسر دون الحد الأدنى للقناة الصاعدة يوم أمس. خلال

Paolo Greco 03:03 2025-03-21 UTC+2

توصيات وتحليل التداول لزوج اليورو/الدولار الأمريكي في 21 مارس — فرصة للدولار؟

يوم الخميس، استمر زوج العملات EUR/USD في إحباط المتداولين. نعتقد أن هذا ليس أفضل وقت للتداول في سوق الفوركس. الصورة الفنية لليورو على الإطار الزمني الساعي مربكة للغاية

Paolo Greco 03:03 2025-03-21 UTC+2

GBP/USD: خطة التداول للجلسة الأمريكية في 20 مارس (تحليل التداولات الصباحية)

في توقعاتي الصباحية، ركزت على مستوى 1.2983 وخططت لاتخاذ قرارات التداول بناءً عليه. بالنظر إلى الرسم البياني لمدة 5 دقائق، يمكننا تحليل ما حدث. حدث كسر لمستوى 1.2983، ولكن

Miroslaw Bawulski 18:25 2025-03-20 UTC+2

EUR/USD: خطة التداول للجلسة الأمريكية في 20 مارس (تحليل التداولات الصباحية)

في توقعاتي الصباحية، ركزت على مستوى 1.0888 وخططت لاستخدامه كنقطة قرار لدخول السوق. دعونا نلقي نظرة على الرسم البياني لمدة 5 دقائق ونحلل ما حدث. قدم الاختراق وإعادة الاختبار اللاحقة

Miroslaw Bawulski 18:19 2025-03-20 UTC+2

كيف تتداول زوج الجنيه الإسترليني/الدولار الأمريكي في 20 مارس؟ نصائح بسيطة وتحليل التداول للمبتدئين

واصل زوج الجنيه الإسترليني/الدولار الأمريكي حركته الصعودية يوم الأربعاء. بعد أن أبقى الاحتياطي الفيدرالي على سعر الفائدة الرئيسي دون تغيير وخفض توقعات النمو الاقتصادي للولايات المتحدة، انخفض الدولار مرة أخرى

Paolo Greco 06:47 2025-03-20 UTC+2

كيفية تداول زوج اليورو/الدولار الأمريكي في 20 مارس؟ نصائح بسيطة وتحليل التداول للمبتدئين

تداول زوج العملات اليورو/الدولار الأمريكي بانخفاض طفيف يوم الأربعاء، وكان ذلك محض صدفة، حيث أغلقت الجنيه الإسترليني أيضًا أقل من إغلاق يوم الثلاثاء. لا يزال الاتجاه الصعودي مستقرًا، كما يتضح

Paolo Greco 06:47 2025-03-20 UTC+2
لا تستطيع التحدث الآن؟
اطرح سؤالك في الدردشة.
Widget callback
 

Dear visitor,

Your IP address shows that you are currently located in the USA. If you are a resident of the United States, you are prohibited from using the services of InstaFintech Group including online trading, online transfers, deposit/withdrawal of funds, etc.

If you think you are seeing this message by mistake and your location is not the US, kindly proceed to the website. Otherwise, you must leave the website in order to comply with government restrictions.

Why does your IP address show your location as the USA?

  • - you are using a VPN provided by a hosting company based in the United States;
  • - your IP does not have proper WHOIS records;
  • - an error occurred in the WHOIS geolocation database.

Please confirm whether you are a US resident or not by clicking the relevant button below. If you choose the wrong option, being a US resident, you will not be able to open an account with InstaForex anyway.

We are sorry for any inconvenience caused by this message.