empty
05.01.2023 08:05 AM
Outlook and trading signals for GBP/USD on January 5. COT report. Analysis of market situation. The pound is unreasonably down, unreasonably up.

M5 chart of GBP/USD

This image is no longer relevant

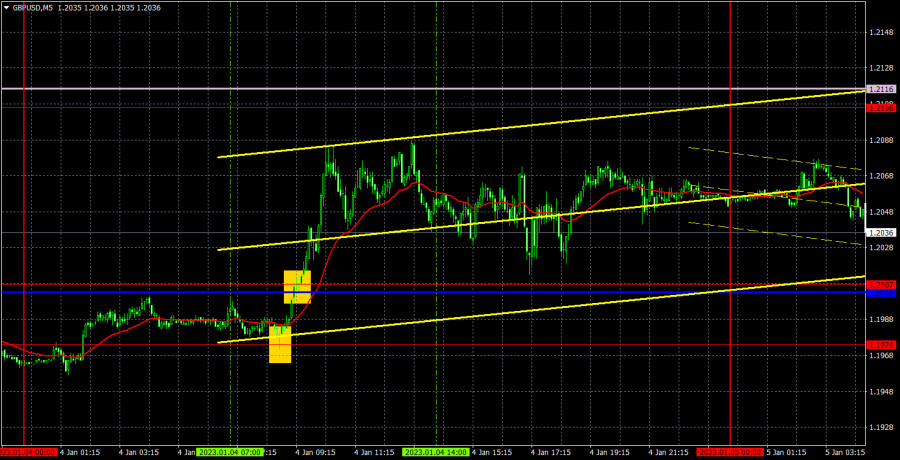
On Wednesday, GBP/USD returned both to the horizontal channel and to the area between the Kijun-Sen and Senkou Span B lines. Thus, the pair is exactly where it has been for the last few weeks - in an absolute flat between 1.2007-1.2106. Right now I don't think that the flat has resumed, but we cannot fully exclude such an option. We should keep in mind that there were no reasons for the pound to fall by 150 points on Tuesday. So yesterday, the market could simply return to its initial positions. In fact, the only macroeconomic event was the US ISM Manufacturing PMI. It fell to 48.4 points in December, which was worse than the most pessimistic forecasts. So overall, we can consider the dollar's fall as logical. The fall happened at night and in the morning, and during the day the pair was in the same place. That's why I think that there was almost no reaction to the ISM report.

Speaking of Wednesday's trading signals, it was as simple as possible. There was a buy signal in the 1.1974-1.2007 area in the morning, inside which also lay the Kijun-sen line. A consolidation above this area made it possible for traders to open long positions, but for the rest of the day, the price failed to reach the nearest target level of 1.2106. Therefore, a long position should have been closed manually anyway. The profit on it was 30-40 pips, which is not too bad.

COT report
This image is no longer relevant

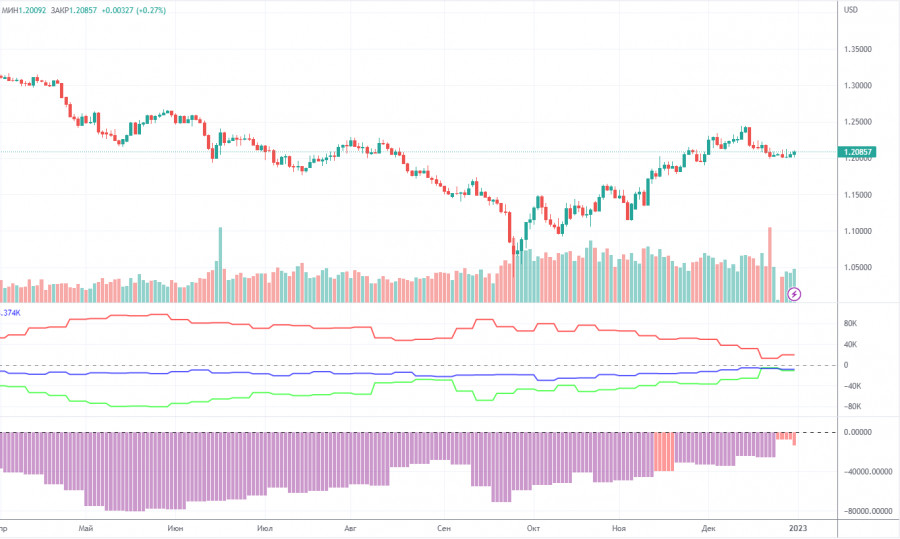
The latest COT report showed that bearish sentiment had weakened. During the given period, non-commercial traders opened 5,300 long positions and as many as 10,600 short positions. Thus, the net position fell by about 5,300. This figure has been on the rise for several months, and the sentiment may become bullish in the near future. Although the pound has grown against the dollar for the last few weeks, it is still difficult to answer why it keeps rising. On the other hand, it could fall in the near future (in the mid-term prospect) because it still needs a correction. In general, in recent months the COT reports correspond to the pound's movements so there shouldn't be any questions. Since the net position is not even bullish yet, buying may continue for a few months to come. Non-commercial traders now hold 40,600,000 long positions and 51,500 short ones. I am still skeptical about the pound's long term growth, though there are technical reasons for it. At the same time, fundamental and geopolitical factors signal that the currency is unlikely to strengthen significantly.

H1 chart of GBP/USD
This image is no longer relevant

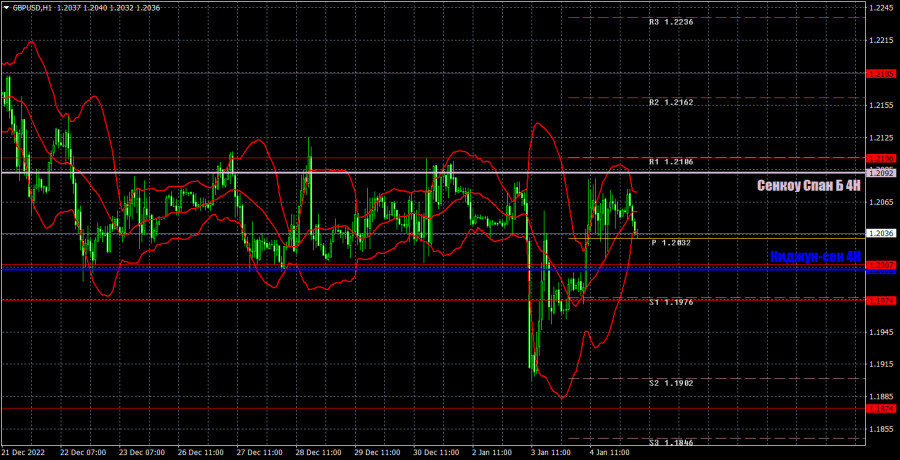
On the one-hour chart, GBP/USD sharply left the horizontal channel and also sharply returned to it. Thus, traders now have the right to expect the flat. Granted that I expect the pound to fall, so far there aren't many technical signals for selling. Such signals may be considered as a rebound from the Senkou Span B line or consolidation below the critical line, which lies just at the lower limit of the horizontal channel. On January 5, the pair may trade at the following levels: 1.1645, 1.1760, 1.1874, 1.1974-1.2007, 1.2106, 1.2185, 1.2259. Senkou Span B (1.2092) and Kijun Sen (1.2003) lines may also generate signals. Pullbacks and breakouts through these lines may produce signals as well. A Stop Loss order should be set at the breakeven point after the price passes 20 pips in the right direction. Ichimoku indicator lines may move during the day, which should be taken into account when determining trading signals. In addition, the chart does illustrate support and resistance levels, which could be used to lock in profits. On Thursday, the UK will publish the index of business activity in the service sector in the second estimate for December, which may rise to 50.0. But I don't think this report is overly important. The only other important data in America are ADP, unemployment claims and S&P service sector index for December at its second estimate.

What we see on the trading charts:

Price levels of support and resistance are thick red lines, near which the movement may end. They do not provide trading signals.

The Kijun-sen and Senkou Span B lines are the lines of the Ichimoku indicator, moved to the one-hour chart from the 4-hour one. They are strong lines.

Extreme levels are thin red lines from which the price bounced earlier. They provide trading signals.

Yellow lines are trend lines, trend channels, and any other technical patterns.

Indicator 1 on the COT charts reflects the net position size of each category of traders.

Indicator 2 on the COT charts reflects the net position size for the non-commercial group.

Paolo Greco,
الخبير التحليلي لدى شركة إنستافوركس
© 2007-2025
حدد الإطار الزمني
5
د
15
د
30
د
1
س
4
ساعات
1
يوم
1
أسبوع
كسب عائد من تغيرات أسعار العملات المشفرة مع إنستافوركس.
قم بتحميل منصة التداول ميتاتريدر 4 وافتح أول صفقة.
  • Grand Choice
    Contest by
    InstaForex
    InstaForex always strives to help you
    fulfill your biggest dreams.
    انضم إلى المسابقة

المقالات الموصى بها

كيفية تداول زوج الجنيه الإسترليني/الدولار الأمريكي في 28 أبريل؟ نصائح بسيطة وتحليل التداول للمبتدئين

لم يظهر زوج الجنيه الإسترليني/الدولار الأمريكي أي تحركات مثيرة للاهتمام يوم الجمعة. مثل اليورو، بقي الجنيه البريطاني قريبًا جدًا من نطاق ثابت. ومع ذلك، لا تزال العملة البريطانية تحافظ

Paolo Greco 05:51 2025-04-28 UTC+2

كيفية تداول زوج اليورو/الدولار الأمريكي في 28 أبريل؟ نصائح بسيطة وتحليل التداول للمبتدئين

واصل زوج العملات EUR/USD التداول بشكل جانبي يوم الجمعة. يستمر السوق في تجاهل جميع البيانات الاقتصادية الكلية، وقد أكد الأسبوع الماضي مرة أخرى هذه الحقيقة الواضحة. حتى دون النظر

Paolo Greco 05:51 2025-04-28 UTC+2

توصيات وتحليل التداول لزوج الجنيه الإسترليني/الدولار الأمريكي في 28 أبريل: الجنيه لا يصدق في التهدئة

واصل زوج العملات GBP/USD التداول الجانبي يوم الجمعة، محافظًا على مستوياته القريبة من أعلى مستوياتها في ثلاث سنوات. إن رفض الجنيه الإسترليني حتى لتصحيح طفيف نحو الأسفل يظهر عدم تصديق

Paolo Greco 04:14 2025-04-28 UTC+2

توصيات وتحليل التداول لليورو/الدولار الأمريكي 28 أبريل: استمرار الاتجاه العرضي

واصل زوج العملات EUR/USD التداول بشكل جانبي طوال يوم الجمعة. في النصف الثاني من الأسبوع الماضي، تداول اليورو حصريًا بين المستويات 1.1321 و1.1391، على الرغم من أن القناة الجانبية العامة

Paolo Greco 04:13 2025-04-28 UTC+2

GBP/USD: خطة التداول للجلسة الأمريكية في 25 أبريل (مراجعة تداولات الصباح)

في توقعاتي الصباحية، ركزت على مستوى 1.3310 وخططت لاتخاذ قرارات التداول من هناك. دعونا نلقي نظرة على الرسم البياني لمدة 5 دقائق ونرى ما حدث. الارتفاع والاختراق الكاذب بالقرب

Miroslaw Bawulski 19:05 2025-04-25 UTC+2

EUR/USD: خطة التداول للجلسة الأمريكية في 25 أبريل (مراجعة تداولات الصباح)

في توقعاتي الصباحية، ركزت على مستوى 1.1391 وخططت لاتخاذ قرارات الدخول حوله. دعونا نلقي نظرة على الرسم البياني لمدة 5 دقائق ونقيم ما حدث. ارتفع الزوج بالفعل، لكنه

Miroslaw Bawulski 19:00 2025-04-25 UTC+2

كيفية تداول زوج الجنيه الإسترليني/الدولار الأمريكي في 25 أبريل؟ نصائح بسيطة وتحليل التداول للمبتدئين

واصل زوج الجنيه الإسترليني/الدولار الأمريكي التداول في الاتجاه الصاعد يوم الخميس على الرغم من عدم وجود أسباب موضوعية لهذا التحرك. لم تكن هناك أحداث أو أخبار مهمة في المملكة المتحدة،

Paolo Greco 07:06 2025-04-25 UTC+2

كيفية تداول زوج اليورو/الدولار الأمريكي في 25 أبريل؟ نصائح بسيطة وتحليل تداول للمبتدئين

في يوم الخميس، تداول زوج العملات EUR/USD مع ميل طفيف نحو الارتفاع، على الرغم من أنه كان من المنطقي أكثر أن نشهد انخفاضًا في النصف الثاني من اليوم

Paolo Greco 07:06 2025-04-25 UTC+2

توصيات وتحليل التداول لزوج الجنيه الإسترليني/الدولار الأمريكي في 25 أبريل: الجنيه لا يتراجع

في يوم الخميس، استمر زوج العملات GBP/USD في التداول على "الطريقة الأوروبية". كانت التحركات داخل اليوم ضعيفة نسبيًا، وتشير الصورة الفنية إلى أن الاتجاه قد يتحول نحو الانخفاض. لقد استقرت

Paolo Greco 03:48 2025-04-25 UTC+2

توصيات وتحليل التداول لليورو/الدولار الأمريكي في 25 أبريل: السوق ينتظر إعلانات جديدة من ترامب

تداول زوج العملات EUR/USD بهدوء أكبر يوم الخميس مقارنة بالنصف الأول من الأسبوع، وكان السوق أيضًا أكثر تقنية نسبيًا. منذ بداية الأسبوع، كنا نكرر نفس الرسالة - تحركات السوق كانت

Paolo Greco 03:48 2025-04-25 UTC+2
لا تستطيع التحدث الآن؟
اطرح سؤالك في الدردشة.
Widget callback
 

Dear visitor,

Your IP address shows that you are currently located in the USA. If you are a resident of the United States, you are prohibited from using the services of InstaFintech Group including online trading, online transfers, deposit/withdrawal of funds, etc.

If you think you are seeing this message by mistake and your location is not the US, kindly proceed to the website. Otherwise, you must leave the website in order to comply with government restrictions.

Why does your IP address show your location as the USA?

  • - you are using a VPN provided by a hosting company based in the United States;
  • - your IP does not have proper WHOIS records;
  • - an error occurred in the WHOIS geolocation database.

Please confirm whether you are a US resident or not by clicking the relevant button below. If you choose the wrong option, being a US resident, you will not be able to open an account with InstaForex anyway.

We are sorry for any inconvenience caused by this message.