empty
 
 
06.02.2023 11:49 AM
EUR/USD and GBP/USD technical analysis on February 6, 2023

EUR/USD

This image is no longer relevant

Higher time frames

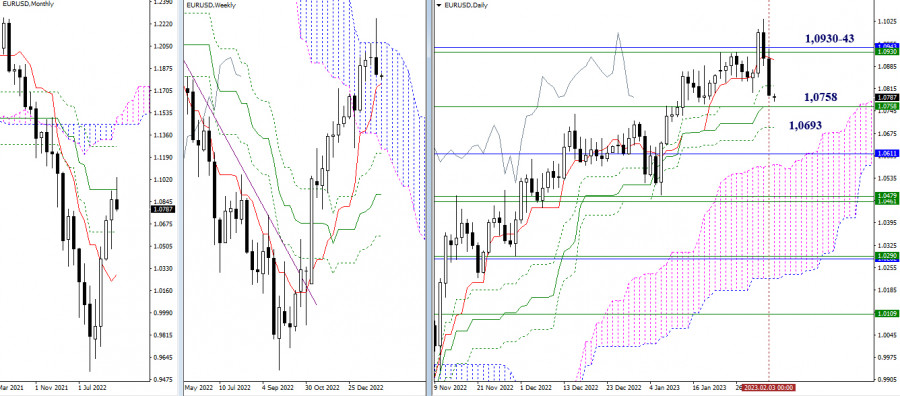
Last week, the pair bounced off the resistance area at 1.0930-43 which coincided with the upper boundary of the weekly Ichimoku Cloud and the monthly medium-term trend. To confirm a rebound and extend it further to the downside, bears need to overcome the support of the weekly short-term trend at 1.0758 and cancel the Golden Cross at 1.0758 – 1.0693.

This image is no longer relevant

H4 – H1

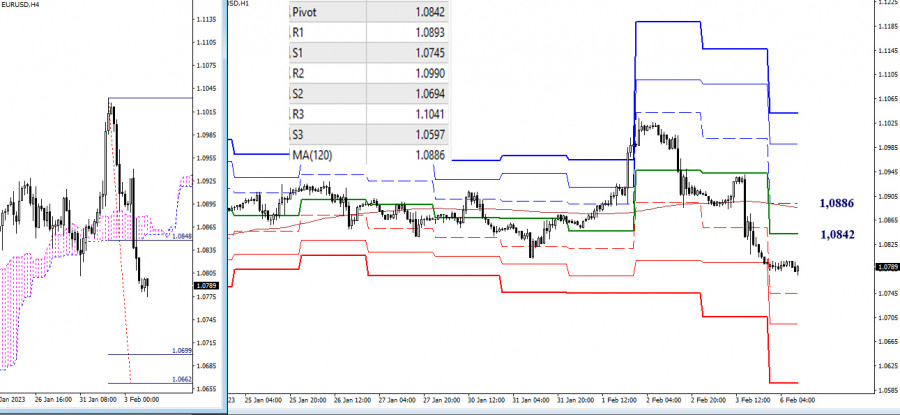
At the moment, bears have seized the initiative on lower time frames. Their downward targets for today are found at the standard pivot levels of 1.0745 – 1.0694 – 1.0597. Another target is the breakout point of the H4 Ichimoku Cloud at 1.0699 – 1.0692. Notably, the support zones on lower time frames are fortified by the support area on longer time periods at 1.0758 – 1.0693. The resistance is now formed by the key levels of the standard pivot point at 1.0842 and the weekly long-term trend at 1.0886. A firm hold above this price range may change the market balance.

***

GBP/USD

This image is no longer relevant

Higher time frames

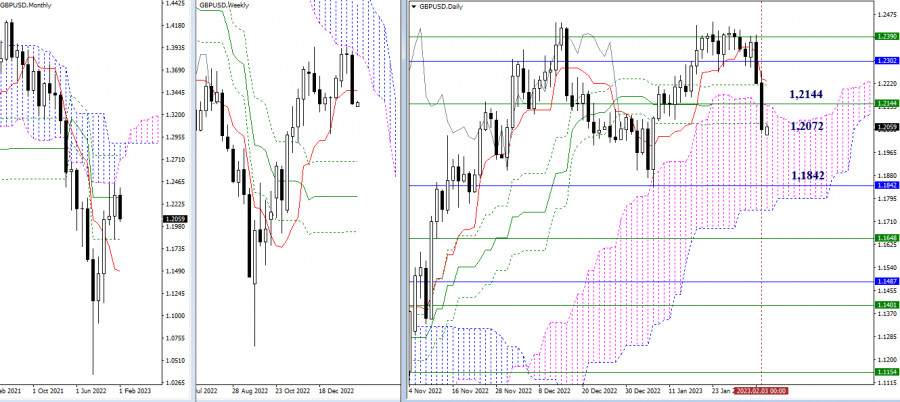
After trading for some time along the resistance level and the lower boundary of the weekly Ichimoku Cloud at 1.2390, the pair came under the control of the sellers. As a result, it closed last week below the key support levels of 1.2144 (weekly short-term trend) and 1.2072 (lower level of the daily Golden Cross). So, bears have entered the daily cloud and are confidently holding there. The levels left behind will now serve as new resistance that will protect the bearish trend. The next downward target is currently seen at the lower boundary of the daily Ichimoku Cloud and the monthly level of 1.1842.

This image is no longer relevant

H4 – H1

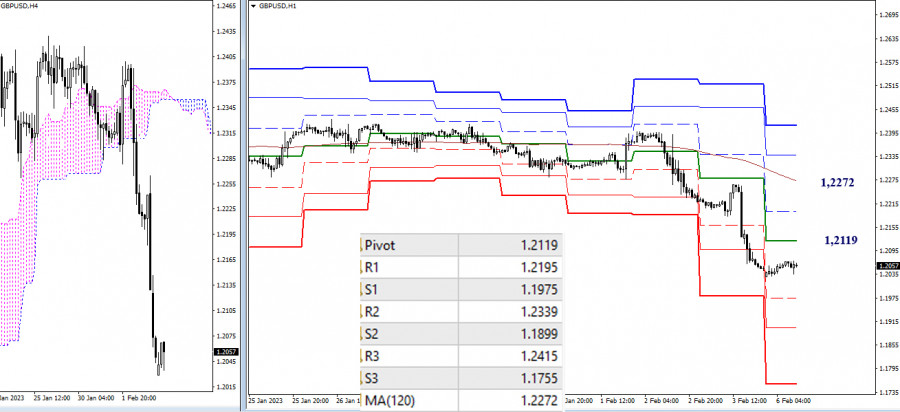
On lower time frames, bears are in control of the market. In the last few hours, the pair has been going through a correction. To deepen its current decline, the pair will need to pass the intraday support formed by the standard pivot levels of 1.1975 – 1.1899 – 1.1755. The key levels of the day are located at 1.2119 (daily central pivot level) and 1.2272 (weekly long-term trend). Consolidation above this range will change the market balance.

***

Technical analysis is based on:

Higher time frames – Ichimoku Kinko Hyo (9.26.52) + Fibo Kijun levels

Lower time frames – H1: Pivot Points (standard) + 120-day Moving Average (weekly long-term trend)

Evangelos Poulakis,
الخبير التحليلي لدى شركة إنستافوركس
© 2007-2024
كسب عائد من تغيرات أسعار العملات المشفرة مع إنستافوركس.
قم بتحميل منصة التداول ميتاتريدر 4 وافتح أول صفقة.
  • Grand Choice
    Contest by
    InstaForex
    InstaForex always strives to help you
    fulfill your biggest dreams.
    انضم إلى المسابقة
  • إيداع الحظ
    قم بإيداع 3,000 دولار في حسابك واحصل على $3,000 وأكثر من ذالك!
    في نوفمبر نحن نقدم باليانصيب $3,000 ضمن حملة إيداع الحظ!
    احصل على فرصة للفوز من خلال إيداع 3,000 دولار في حساب تداول. بعد أن استوفيت هذا الشرط، تصبح مشاركًا في الحملة.
    انضم إلى المسابقة
  • تداول بحكمة، اربح جهازا
    قم بتعبئة حسابك بمبلغ لا يقل عن 500 دولار ، واشترك في المسابقة ، واحصل على فرصة للفوز بأجهزة الجوال.
    انضم إلى المسابقة
  • بونص 100٪
    فرصتك الفريدة للحصول على بونص 100٪ على إيداعك
    احصل على بونص
  • بونص 55٪
    تقدم بطلب للحصول على بونص 55٪ على كل إيداع
    احصل على بونص
  • بونص 30٪
    احصل على بونص 30٪ في كل مرة تقوم فيها بتعبئة حسابك
    احصل على بونص

المقالات الموصى بها

لا تستطيع التحدث الآن؟
اطرح سؤالك في الدردشة.
Widget callback