empty
08.02.2023 04:44 PM
S&P 500 outlook for February 8, 2023

This image is no longer relevant

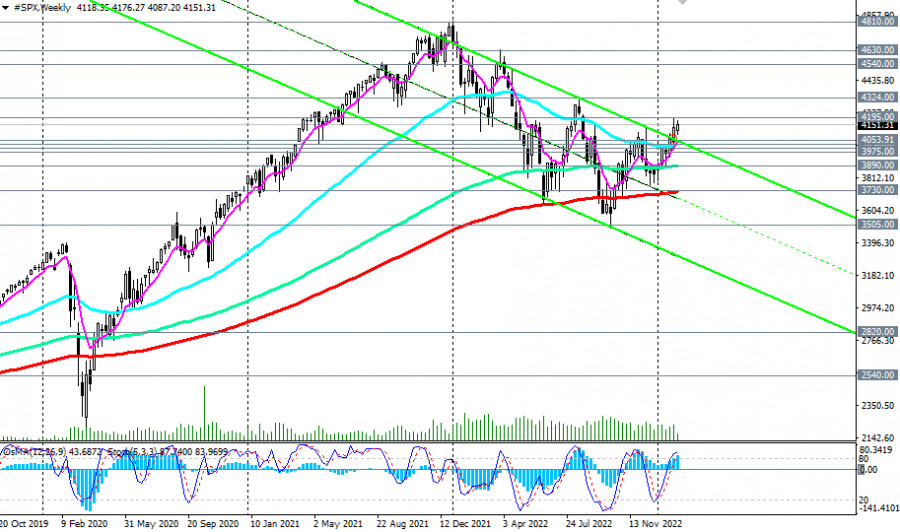
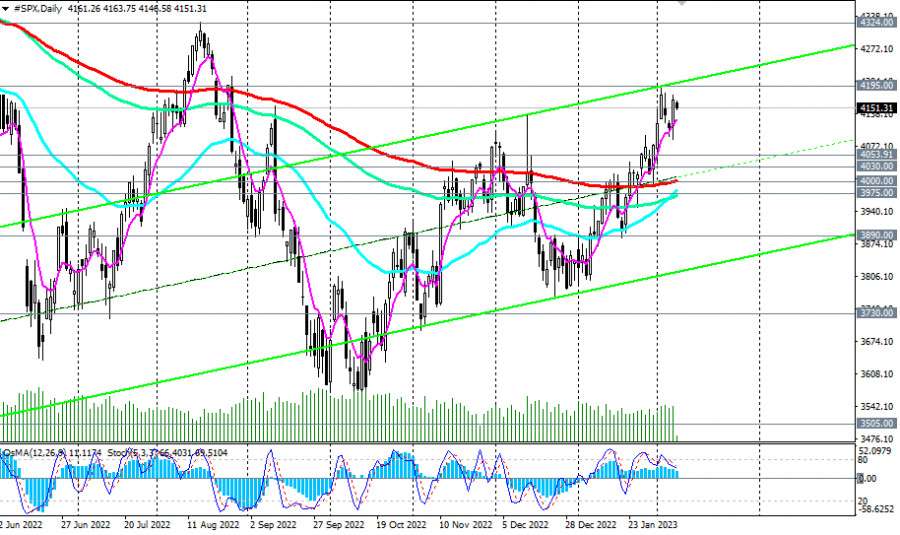
Futures on S&P 500 broad market index (reflected as CFD #SPX in the trading terminal) remain positive, trading in a bull market zone, above key support levels 4030.00 (50 EMA on the weekly chart), 4000.00 (200 EMA on the daily chart).

Despite the Fed's hawkish statements about the prospects for monetary policy, economists believe that it remains soft, given high inflation and a strong labor market. At the same time, high inflation contributes to the further depreciation of the dollar. In addition, the U.S. stock market seems to have turned upward again after the December Fed meeting, at which the rate was raised by 0.50% (and not by 0.75%, as it was in June, July, September, November) and Fed Chairman Jerome Powell noted that "the received data on inflation for October and November do indicate a long-awaited reduction in price pressure" although, in his opinion, "much more evidence is needed to be sure of a decrease in inflation."

After the December meeting, market participants began to bet on a further slowdown in the pace of the Fed's interest rate hike, and then on a pause and, possibly, the reverse process in the near future.

This image is no longer relevant

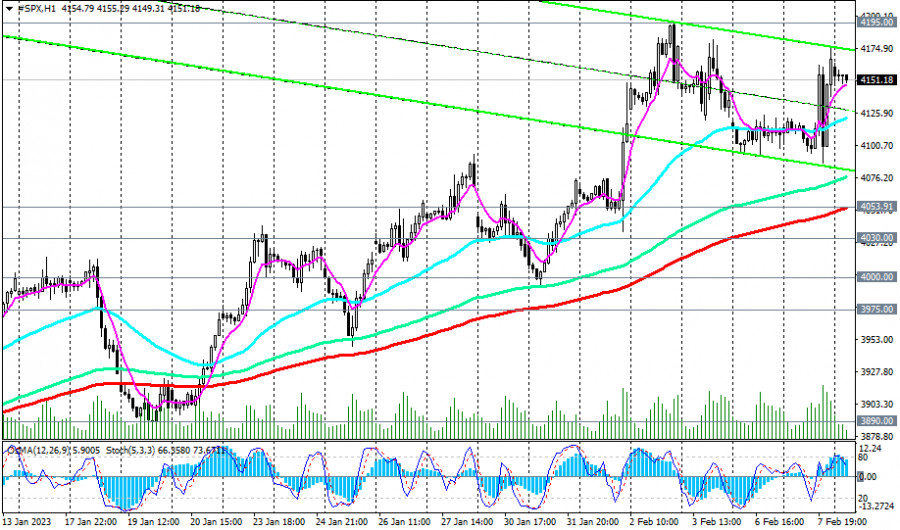
One way or another, the S&P500 futures are currently trading near 4150.00, in the zone of 6-month highs reached on February 2 near 4195.00. The breakout of this local resistance level will be additional evidence in favor of the revival of the global bullish trend of the S&P 500 and, perhaps, of the entire U.S. stock market.

Above the important short-term support at 4054.00 (200 EMA on the 1-hour chart), nothing threatens long positions.

This image is no longer relevant

But its breakdown will be the first signal for shorts trading on the S&P 500. The breakdown of the key support level 4000.00 (200 EMA on the daily chart), 3975.00 (144 EMA on the daily chart) will return the S&P 500 inside the downward channel on the weekly chart, sending the index to the key support level 3730.00 (200 EMA on the weekly chart).

However, only a breakdown of the strategic support levels 2820.00 (144 EMA on the monthly chart), 2540.00 (200 EMA on the monthly chart) will indicate the breaking of the long-term bullish trend of the S&P 500.

In general, the buy-and-hold strategy is still relevant for the U.S. stock market and its S&P 500 index.

Support levels: 4122.00 4085.00 4054.00 4030.00 4000.00 3975.00 3890.00 3800.00 3730.00 3700.00 3600.00 3500.00 2820.00 0.040

Resistance levels: 4195.00, 4324.00, 4540.00, 4630.00, 4810.00

Trading recommendations

Sell Stop 4085.00. Stop-Loss 4205.00. Whole 4054.00, 4030.00, 4000.00, 3975.00, 3890.00, 3800.00, 3730.00

Buy Stop 4205.00. Stop-Loss 4085.00. Whole 4300.00, 4320.00, 4400.00, 4500.00, 4600.00, 4700.0, 4800.00, 4900.00

Jurij Tolin,
الخبير التحليلي لدى شركة إنستافوركس
© 2007-2025
حدد الإطار الزمني
5
د
15
د
30
د
1
س
4
ساعات
1
يوم
1
أسبوع
كسب عائد من تغيرات أسعار العملات المشفرة مع إنستافوركس.
قم بتحميل منصة التداول ميتاتريدر 4 وافتح أول صفقة.
  • Grand Choice
    Contest by
    InstaForex
    InstaForex always strives to help you
    fulfill your biggest dreams.
    انضم إلى المسابقة

المقالات الموصى بها

كيفية تداول زوج الجنيه الإسترليني/الدولار الأمريكي في 11 يونيو؟ نصائح بسيطة وتحليل التداول للمبتدئين

في يوم الثلاثاء، تداول زوج الجنيه الإسترليني/الدولار الأمريكي مع ميل هبوطي، وهو ما كان مبررًا بعدة عوامل. أولاً، استقر الزوج تحت خط الاتجاه الصاعد. لا نعتقد أن اتجاهًا هبوطيًا جديدًا

Paolo Greco 06:10 2025-06-11 UTC+2

كيفية تداول زوج اليورو/الدولار الأمريكي في 11 يونيو؟ نصائح بسيطة وتحليل التداول للمبتدئين

في يوم الثلاثاء، أظهر زوج العملات EUR/USD مرة أخرى عدم نيته في التداول النشط. خلال الأيام الثلاثة الماضية، تشكلت قناة جانبية على الإطار الزمني للساعة، وظلت تقلبات الزوج منخفضة جدًا

Paolo Greco 06:10 2025-06-11 UTC+2

توصيات وتحليل التداول لزوج الجنيه الإسترليني/الدولار الأمريكي في 11 يونيو: الجنيه يتوقف قبل اندفاع جديد

واصل زوج العملات GBP/USD التداول بطريقة فوضوية إلى حد ما يوم الثلاثاء، ولكن مع نغمة هبوطية. انخفض الجنيه الإسترليني قليلاً على الأقل بعد أن تحول الاتجاه إلى الأسفل. نذكر

Paolo Greco 03:31 2025-06-11 UTC+2

توصيات وتحليل التداول لزوج اليورو/الدولار الأمريكي في 11 يونيو: حركة مسطحة عند القمم

واصل زوج العملات EUR/USD التحرك في كلا الاتجاهين طوال يوم الثلاثاء. تشير هذه التحركات إلى سوق مسطح. دعونا نتذكر أنه في وقت سابق، اخترق الزوج خط الاتجاه الصاعد للمرة الثانية،

Paolo Greco 03:31 2025-06-11 UTC+2

GBP/USD: خطة التداول للجلسة الأمريكية في 10 يونيو (مراجعة التداولات الصباحية)

في توقعاتي الصباحية، لفتُّ الانتباه إلى مستوى 1.3545 وخططت لاتخاذ قرارات دخول السوق بناءً عليه. دعونا نلقي نظرة على الرسم البياني لمدة 5 دقائق لنرى ما حدث. أدى الارتفاع يليه

Miroslaw Bawulski 18:26 2025-06-10 UTC+2

EUR/USD: خطة التداول للجلسة الأمريكية في 10 يونيو (مراجعة تداولات الصباح)

في توقعاتي الصباحية، قمت بتسليط الضوء على مستوى 1.1388 وخططت لاتخاذ قرارات دخول السوق بناءً عليه. دعونا نلقي نظرة على الرسم البياني لمدة 5 دقائق لنرى ما حدث. أدى الانخفاض

Miroslaw Bawulski 18:22 2025-06-10 UTC+2

كيفية تداول زوج الجنيه الإسترليني/الدولار الأمريكي في 10 يونيو؟ نصائح بسيطة وتحليل التداول للمبتدئين

تداول زوج الجنيه الإسترليني/الدولار الأمريكي في كلا الاتجاهين يوم الاثنين. يوم الجمعة، استقرت الأسعار تحت خط الاتجاه الصاعد، مما غيّر الاتجاه رسميًا إلى هبوطي. رسميًا - لأننا رأينا شيئًا مشابهًا

Paolo Greco 06:40 2025-06-10 UTC+2

كيفية تداول زوج اليورو/الدولار الأمريكي في 10 يونيو؟ نصائح بسيطة وتحليل التداول للمبتدئين

تداول زوج العملات EUR/USD بتقلب منخفض وفي كلا الاتجاهين يوم الاثنين. في ذلك اليوم، كان السياق الاقتصادي الكلي غائبًا تقريبًا، مما ترك المتداولين مع القليل جدًا للتفاعل معه. بالطبع، تستمر

Paolo Greco 06:40 2025-06-10 UTC+2

توصيات وتحليلات التداول لزوج الجنيه الإسترليني/الدولار الأمريكي في 10 يونيو: الجنيه ليس في عجلة من أمره للهبوط أيضًا

في يوم الاثنين، فشل زوج العملات GBP/USD بشكل متوقع في مواصلة حركته الهبوطية. نذكر أنه في وقت سابق، شكل السعر مرة أخرى إشارة لانعكاس الاتجاه إلى الاتجاه الهبوطي

Paolo Greco 04:11 2025-06-10 UTC+2

توصيات وتحليل التداول لليورو/الدولار الأمريكي في 10 يونيو: يوم آخر، وجرعة أخرى من السلبية

تداول زوج العملات EUR/USD بشكل متباين طوال يوم الاثنين. وعلى الرغم من كسر خط الاتجاه، إلا أن الحركة الهبوطية (أي تقوية الدولار الأمريكي) لم تبدأ فعليًا. وبالتالي، لا تزال الإشارات

Paolo Greco 04:11 2025-06-10 UTC+2
لا تستطيع التحدث الآن؟
اطرح سؤالك في الدردشة.
Widget callback
 

Dear visitor,

Your IP address shows that you are currently located in the USA. If you are a resident of the United States, you are prohibited from using the services of InstaFintech Group including online trading, online transfers, deposit/withdrawal of funds, etc.

If you think you are seeing this message by mistake and your location is not the US, kindly proceed to the website. Otherwise, you must leave the website in order to comply with government restrictions.

Why does your IP address show your location as the USA?

  • - you are using a VPN provided by a hosting company based in the United States;
  • - your IP does not have proper WHOIS records;
  • - an error occurred in the WHOIS geolocation database.

Please confirm whether you are a US resident or not by clicking the relevant button below. If you choose the wrong option, being a US resident, you will not be able to open an account with InstaForex anyway.

We are sorry for any inconvenience caused by this message.