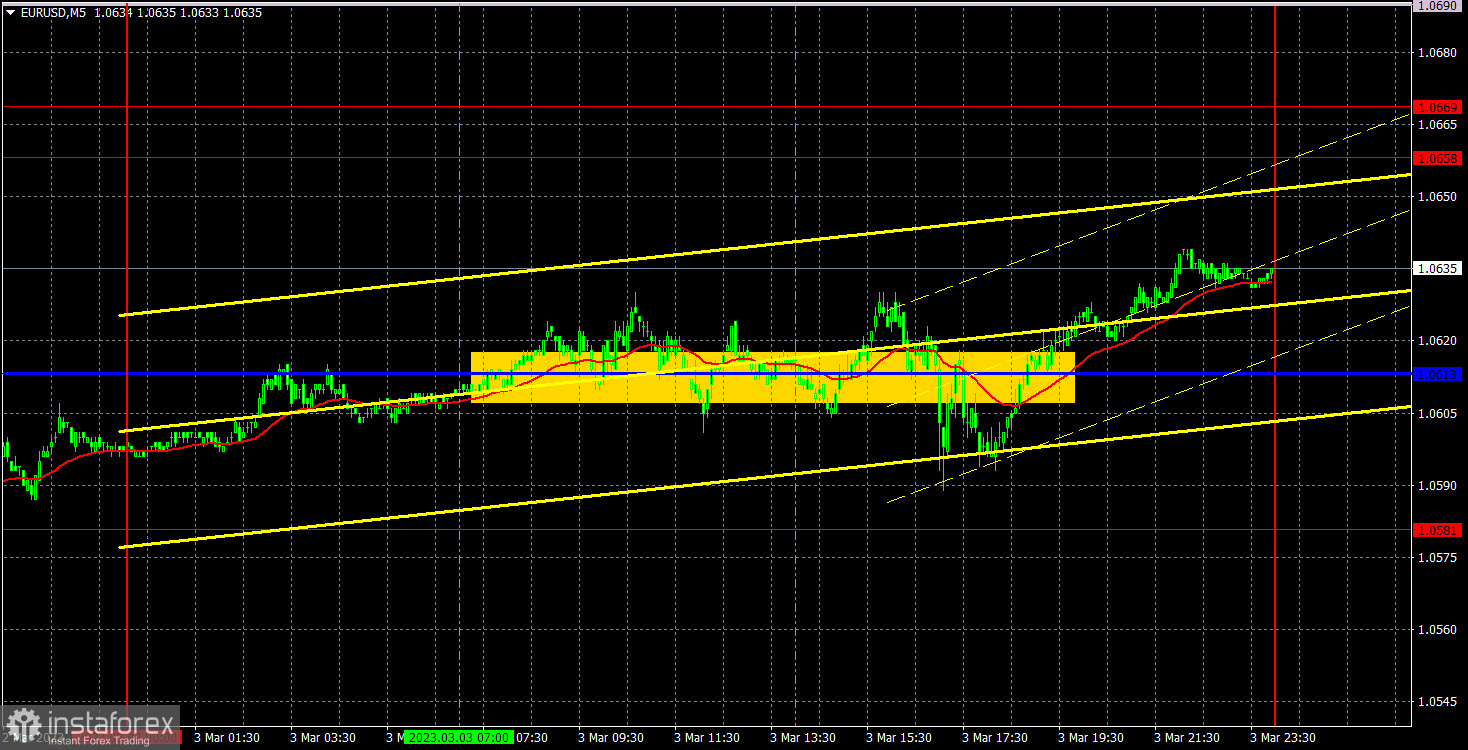
M5 chart of EUR/USD
On Friday, EUR/USD was in a flat trend. In the 1-hour time frame, it showed a sluggish movement. In the 5-minute time frame, it was in a flat. The lines of the Ichimoku indicator have almost merged, indicating a flat trend. In terms of macro statistics, the reports that had come, including the ISM non-manufacturing PMI, had no effect on the price. All in all, we could see a minor bullish correction. In the medium term, the downtrend is likely to resume.
Speaking of trading signals, the pair hovered near the psychological line during the day. So, it was almost impossible to yield some profit at least. Traders who had tried to price the first two signals near this line were bound to losses. There was no point in continuing trading afterward.
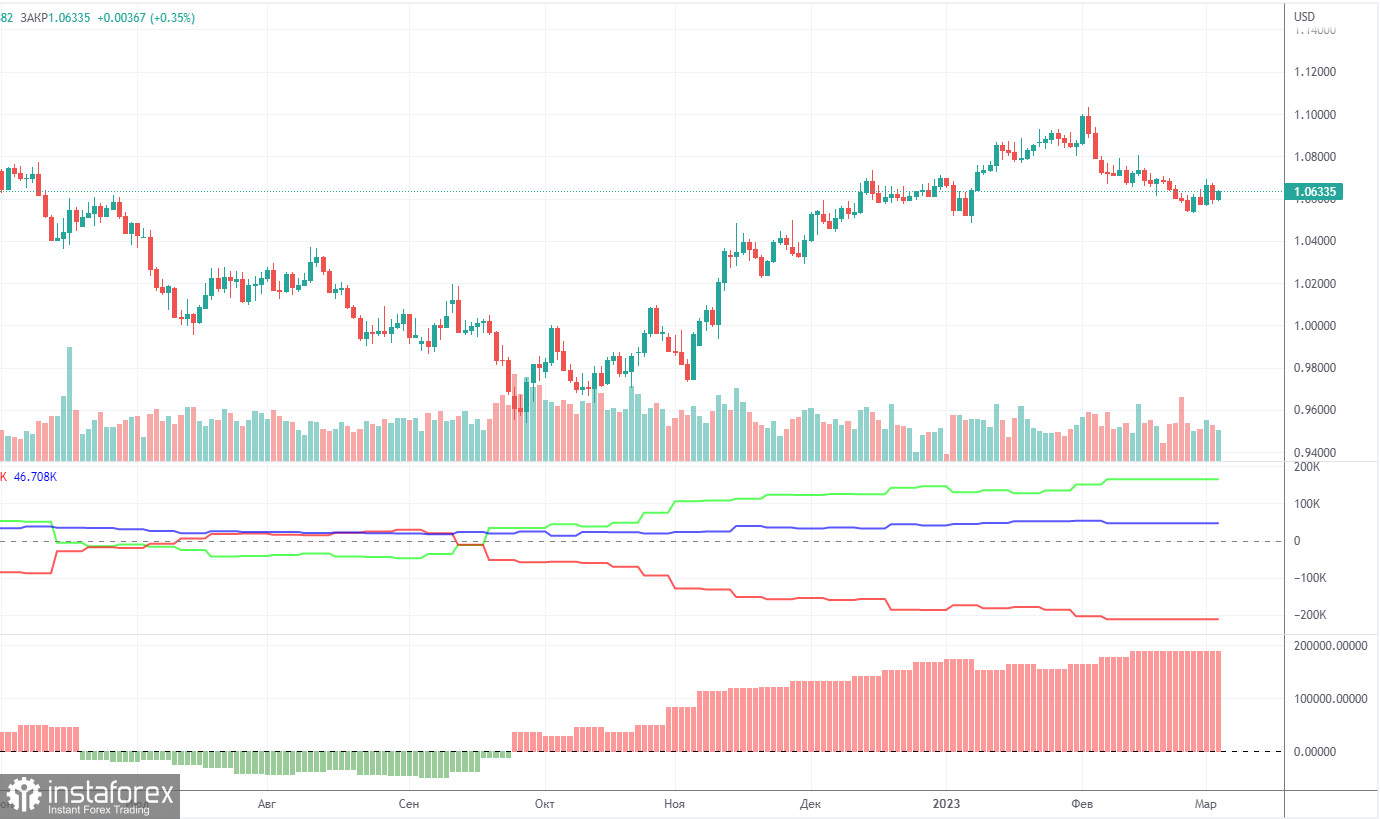
COT report:
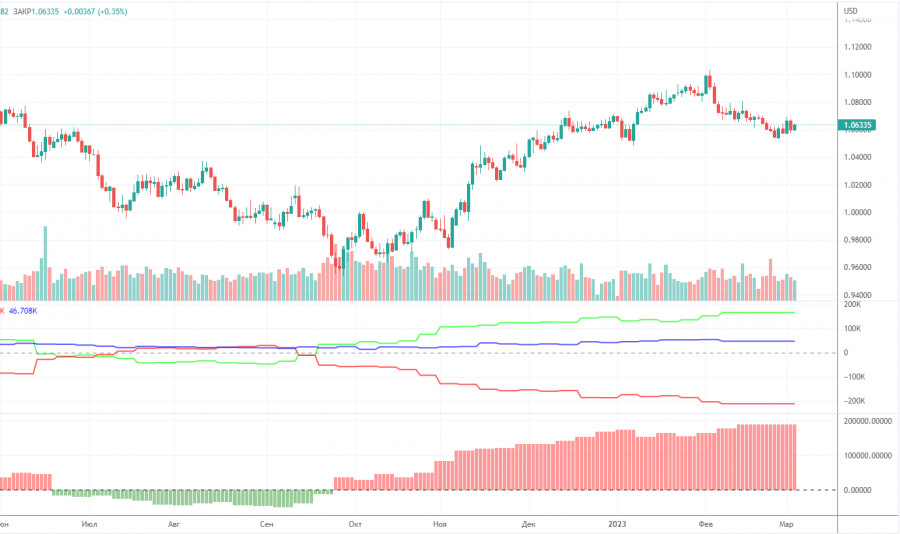
Due to a technical glitch, the Commodity Futures Trading Commission will likely publish reports with a month delay. Clearly, analyzing such reports will be of no use. Anyway will continue doing so. The situation may change for the better in the future. So far, we can say that the coming reports have been in line with developments in the market in recent months. According to the COT report from February 7, the net non-commercial position of large traders (second indicator) has risen since September 2022. The net non-commercial position is bullish and continues to increase with each new week, allowing us to expect the uptrend to stop shortly. Such a signal comes from the first indicator, with the green line and the red line being far apart, which is usually a sign of the end of a trend. The euro has already begun its bear move against the greenback. So far, it remains unclear whether it is just a downward correction or a new bear trend. According to the latest report, non-commercial traders closed 8,400 long positions and 22,900 short ones. Consequently, the net position rose by 14,500. The number of long positions exceeds that of short ones by 165,000. In any case, a correction has been looming for a long time. Therefore, even without reports, it is clear that the downtrend will continue.
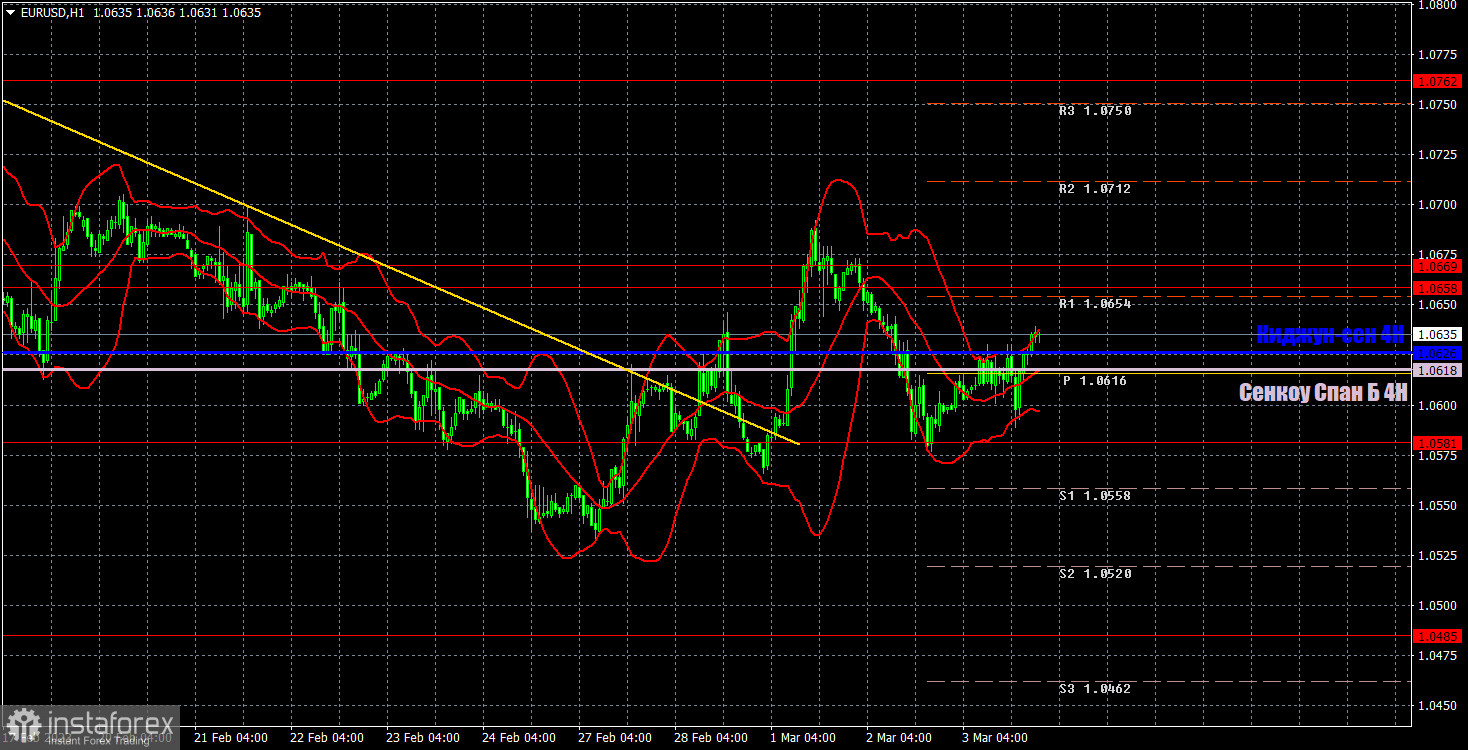
H1 chart of EUR/USD
In the 1-hour time frame, we can see attempts to resume the uptrend. Consolidation above or below any of the Ichimoku lines does not matter. Despite the flat trend, corrections constantly occur. On Monday, trading levels are seen at 1.0340-1.0366, 1.0485, 1.0581, 1.0658-1.0669, 1.0762, 1.0806, Senkou Span B (1.0618), and Kijun-sen (1.0626). Ichimoku indicator lines can move intraday, which should be taken into account when determining trading signals. There are also support and resistance although no signals are made near these levels. They could be made when the price either breaks or rebounds from these extreme levels. Do not forget to place Stop Loss at the breakeven point when the price goes by 15 pips in the right direction. In case of a false breakout, it could save you from possible losses. On March 6, eurozone retail sales will be the only interesting macro report. However, figures will trigger a reaction only if they seriously miss market expectations.
Indicators on charts:
Resistance/support - thick red lines, near which the trend may stop. They do not make trading signals.
Kijun-sen and Senkou Span B are the Ichimoku indicator lines moved to the hourly timeframe from the 4-hour timeframe. They are also strong lines.
Extreme levels are thin red lines, from which the price used to bounce earlier. They can produce trading signals.
Yellow lines are trend lines, trend channels, and any other technical patterns.
Indicator 1 on the COT chart is the size of the net position of each trader category.
Indicator 2 on the COT chart is the size of the net position for the Non-commercial group of traders.