empty
12.04.2023 08:27 AM
GBP/USD: Forecast and trading signals on April 12. COT report. Detailed analysis of price movement and trades. The dollar's hope lies in US inflation.

5M chart of GBP/USD

This image is no longer relevant

On Tuesday, GBP/USD traded higher, stayed above the trendline and the key lines of the Ichimoku indicator. Therefore, we can confirm that the uptrend is still present, and the pound cannot even properly enter a bearish correction. Yesterday, there were no important reports published in the UK or the US, so there was nothing to react to. Volatility has fallen to "average" values in recent weeks. The market is in doubt. It does not want to sell, and it can no longer buy. The situation is becoming even more complicated. The pound should fall, but the market still refuses to let go, ignoring all positive factors for the US dollar.

There were a sufficient number of trading signals. For the pound, we also fixed the latest values of the Ichimoku indicator lines, since the movement has recently stayed within a limited range. However, this didn't even help, since the lines and levels were very close to each other. Therefore, as soon as a signal was formed, the price immediately found itself near the next closest level. And the distance between them was no more than 30 points. Thus, traders could have earned several dozen points of profit, since all the signals marked in the chart were, in principle, correct. But they could also have chosen not to enter the market based on these signals, as they were not the strongest ones.

COT report:

This image is no longer relevant

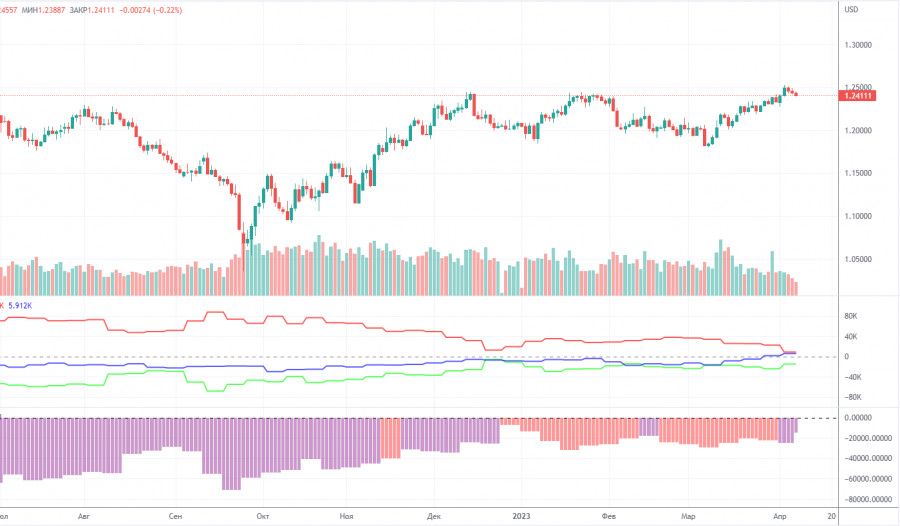
COT reports for the British pound are again released in due time. The latest available report is for April 4th. According to this report, the Non-commercial group opened 18,000 long positions and also opened 8,800 short positions. As a result, the net position of non-commercial traders increased by 9,200 and continues to grow. The net position indicator has been steadily growing for the past 7-8 months, but the sentiment of major players remains bearish. Although the pound sterling is growing against the US dollar in the medium term, it is very difficult to figure out the reasons for the sterling's rally from a fundamental point of view. We absolutely do not exclude the scenario in which a sharper drop in the pound will begin in the short term. Formally, it has already started, but so far this movement looks more like a flat market. We also note that both major pairs are currently following roughly the same pattern, but the net position for the euro is positive and even implies a soon-to-be-ending upward impulse, while for the pound, it is negative, which suggests further growth. The British currency has already rallied by 2,100 points. It is stunning growth without a strong downward correction, so a further rally will be absolutely illogical. The non-commercial group now holds a total of 61,000 shorts and 46,000 longs open. We are still skeptical about the long-term uptrend of the British currency and expect it to fall.

1H chart of GBP/USD

This image is no longer relevant

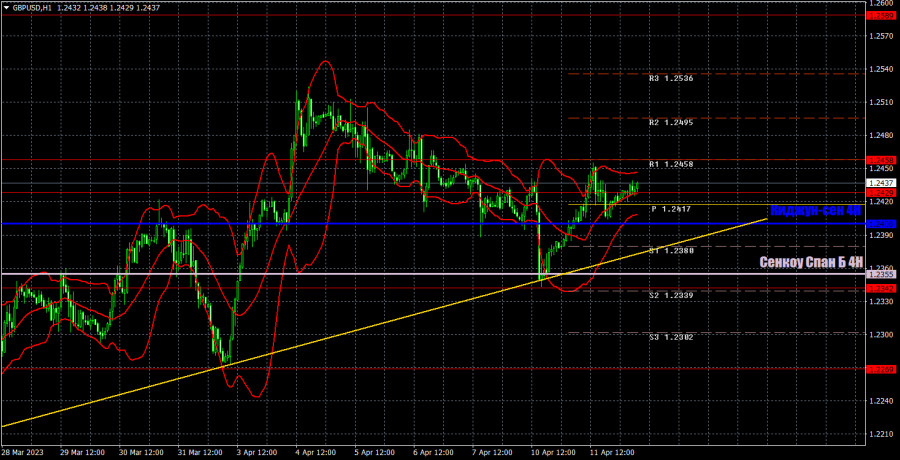
On the one-hour chart, GBP/USD collapsed on Tuesday, but it is already recovering. A new downtrend line has been formed and the price is located below the Ichimoku indicator lines. That's why so far everything says that the downward movement will continue. However, today's macroeconomic background might have a strong influence on the market sentiment, so by the end of the day, the pair could be anywhere. For April 12th, we highlight the following important levels: 1.1927, 1.1965, 1.2143, 1.2185, 1.2269, 1.2342, 1.2429-1.2458, 1.2589, 1.2659, 1.2762. The Senkou Span B (1.2355) and Kijun-sen (1.2400) lines can also generate signals. Rebounds and breakouts from these lines can also serve as trading signals. It is better to set the Stop Loss at breakeven as soon as the price moves by 20 pips in the right direction. The lines of the Ichimoku indicator can change their position throughout the day which is worth keeping in mind when looking for trading signals. On the chart, you can also see support and resistance levels where you can take profit. On Wednesday, Bank of England Governor Andrew Bailey will deliver two speeches in the UK. Meanwhile, the US will release an important inflation report. Each of these three events may provoke a market reaction, but the main focus should be on inflation.

Indicators on charts:

Resistance/support - thick red lines, near which the trend may stop. They do not make trading signals.

Kijun-sen and Senkou Span B are the Ichimoku indicator lines moved to the hourly timeframe from the 4-hour timeframe. They are also strong lines.

Extreme levels are thin red lines, from which the price used to bounce earlier. They can produce trading signals.

Yellow lines are trend lines, trend channels, and any other technical patterns.

Indicator 1 on the COT chart is the size of the net position of each trader category.

Indicator 2 on the COT chart is the size of the net position for the Non-commercial group of traders.

Paolo Greco,
الخبير التحليلي لدى شركة إنستافوركس
© 2007-2025
Summary
Urgency
Analytic
Stanislav Polyanskiy
Start trade
كسب عائد من تغيرات أسعار العملات المشفرة مع إنستافوركس.
قم بتحميل منصة التداول ميتاتريدر 4 وافتح أول صفقة.
  • Grand Choice
    Contest by
    InstaForex
    InstaForex always strives to help you
    fulfill your biggest dreams.
    انضم إلى المسابقة

المقالات الموصى بها

كيفية تداول زوج الجنيه الإسترليني/الدولار الأمريكي في 13 أغسطس؟ نصائح بسيطة وتحليل التداول للمبتدئين

أظهر زوج الجنيه الإسترليني/الدولار الأمريكي أيضًا حركة صعودية قوية نسبيًا، ولكن على عكس زوج اليورو/الدولار الأمريكي، بدأ في الارتفاع منذ الصباح الباكر. دعمت البيانات القادمة من المملكة المتحدة تعزيز الجنيه

Paolo Greco 06:44 2025-08-13 UTC+2

كيفية تداول زوج اليورو/الدولار الأمريكي في 13 أغسطس؟ نصائح بسيطة وتحليل التداول للمبتدئين

في يوم الثلاثاء، تداول زوج العملات اليورو/الدولار الأمريكي بارتفاع لأسباب منطقية تمامًا. أظهر مؤشر أسعار المستهلكين الأمريكي رقماً غير متوقع تمامًا - وهو 2.7%، مما يطابق قيمة الشهر السابق. وبالتالي،

Paolo Greco 06:44 2025-08-13 UTC+2

توصيات التداول وتحليل التداول لزوج الجنيه الإسترليني/الدولار الأمريكي في 13 أغسطس – الجنيه يفاجئ المتداولين

تداول زوج العملات GBP/USD أيضًا بارتفاع يوم الثلاثاء، ولكن هذا التحرك لم يكن مدفوعًا فقط بتقرير التضخم الأمريكي، بل أيضًا بالبيانات البريطانية. لا يمكننا القول إن التقارير البريطانية كانت متميزة،

Paolo Greco 03:49 2025-08-13 UTC+2

توصيات التداول وتحليل تداول زوج اليورو/الدولار الأمريكي في 13 أغسطس – تقرير التضخم أفسد كل شيء

استأنف زوج العملات EUR/USD حركته الصعودية يوم الثلاثاء. لم يكن هذا الاستئناف بدون سبب - كان منطقيًا تمامًا. بينما تجاهل السوق بثقة التقارير الأوروبية الصباحية، لم يكن بإمكانه تجاهل مؤشر

Paolo Greco 03:49 2025-08-13 UTC+2

كيفية تداول زوج الجنيه الإسترليني/الدولار الأمريكي في 12 أغسطس؟ نصائح بسيطة وتحليل التداول للمبتدئين

انخفض زوج الجنيه الإسترليني/الدولار الأمريكي بشكل طفيف يوم الاثنين، لكن تعزيز الدولار لا يعني شيئًا. لم يتمكن السعر حتى من التماسك دون المستوى الأقرب عند 1.3413. لذلك، قد يستأنف الاتجاه

Paolo Greco 06:57 2025-08-12 UTC+2

كيفية تداول زوج اليورو/الدولار الأمريكي في 12 أغسطس؟ نصائح بسيطة وتحليل التداول للمبتدئين

في يوم الاثنين، تداول زوج العملات EUR/USD بانخفاض، على الرغم من عدم وجود أي أسباب اقتصادية كلية أو أساسية تبرر هذا التحرك. ومع ذلك، كان لدى الدولار أسباب فنية لتصحيح

Paolo Greco 06:57 2025-08-12 UTC+2

توصيات التداول وتحليل التداول لزوج الجنيه الإسترليني/الدولار الأمريكي في 12 أغسطس – الاتجاه مستمر

يوم الاثنين، انخفض زوج العملات GBP/USD بشكل طفيف نحو خط الاتجاه الصاعد الجديد، وهو ما لم يعطل الاتجاه الحالي بأي شكل من الأشكال. في الواقع، لم يتوقع الكثيرون أن تقوى

Paolo Greco 03:32 2025-08-12 UTC+2

توصيات التداول وتحليل التداول لزوج اليورو/الدولار الأمريكي في 12 أغسطس – يوم اثنين هادئ والتضخم

يوم الاثنين، أظهر زوج العملات EUR/USD حركة هبوطية ولكنه تداول بشكل عام ضمن نفس النطاق تقريبًا كما في الأيام الأخيرة. كان اليورو يرتفع لمدة أسبوع ونصف، لذا فإن تصحيحًا طفيفًا

Paolo Greco 03:32 2025-08-12 UTC+2

كيفية تداول زوج الجنيه الإسترليني/الدولار الأمريكي في 11 أغسطس؟ نصائح بسيطة وتحليل التداول للمبتدئين

واصل زوج الجنيه الإسترليني/الدولار الأمريكي حركته الصعودية يوم الجمعة. كانت الحركة ضعيفة للغاية، حيث بلغت التقلبات الإجمالية لليوم 43 نقطة فقط. لم تكن هناك أحداث اقتصادية كبرى يوم الجمعة،

Paolo Greco 06:00 2025-08-11 UTC+2

كيفية تداول زوج اليورو/الدولار الأمريكي في 11 أغسطس؟ نصائح بسيطة وتحليل التداول للمبتدئين

في يوم الجمعة، تداول زوج العملات اليورو/الدولار الأمريكي بشكل مستقر تمامًا. لم تكن هناك تقارير اقتصادية مجدولة لذلك اليوم، لذا لم يكن لدى المتداولين أي شيء للتفاعل معه خلال الجلسة

Paolo Greco 06:00 2025-08-11 UTC+2
لا تستطيع التحدث الآن؟
اطرح سؤالك في الدردشة.
Widget callback
 

Dear visitor,

Your IP address shows that you are currently located in the USA. If you are a resident of the United States, you are prohibited from using the services of InstaFintech Group including online trading, online transfers, deposit/withdrawal of funds, etc.

If you think you are seeing this message by mistake and your location is not the US, kindly proceed to the website. Otherwise, you must leave the website in order to comply with government restrictions.

Why does your IP address show your location as the USA?

  • - you are using a VPN provided by a hosting company based in the United States;
  • - your IP does not have proper WHOIS records;
  • - an error occurred in the WHOIS geolocation database.

Please confirm whether you are a US resident or not by clicking the relevant button below. If you choose the wrong option, being a US resident, you will not be able to open an account with InstaForex anyway.

We are sorry for any inconvenience caused by this message.