The currency pair EUR/USD continued its growth on Wednesday, which began the day before. However, at the moment, any movement is quite conditional. It should be remembered that the pair has been growing for almost a whole month, occasionally correcting. However, we still wonder: what is the basis for the euro's growth? The market, of course, can trade as it pleases, but still, there are usually specific reasons and backgrounds for each movement. At the moment, there is nothing like that. We have already said that it is easy to find reasons if desired. For example, one can always say that the euro is growing due to increased risk sentiment in the market. Or because the ECB may raise rates in 2023 more than the Fed. At the same time, one can turn a blind eye to the fact that the US economy is in a much better state than the EU economy. The recession primarily threatens the European economy rather than the American one, and the Fed's rate is higher than the ECB's. One can ignore strong statistics from across the ocean and happily buy euros at any convenient opportunity. And all this will look logical if one discards some factors and works on others with double strength.
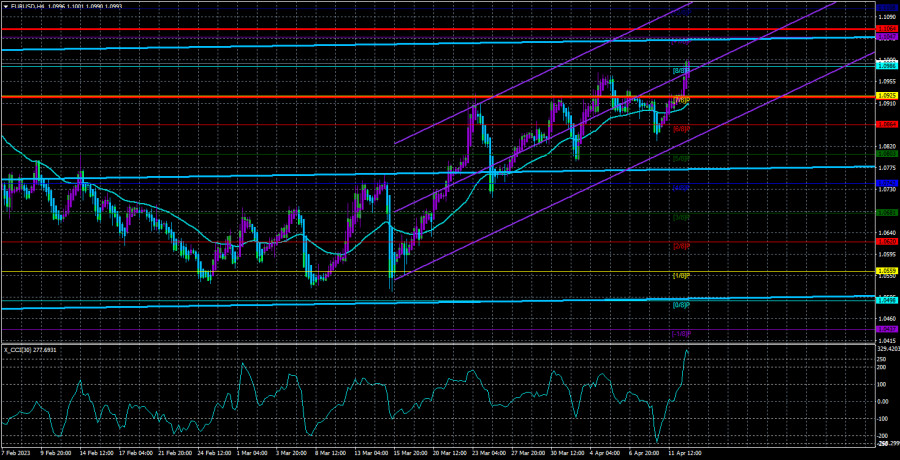
It should be noted that none of the consolidations below the moving average led to a downward trend. That is, the market only occasionally fixes profits on long positions and immediately opens new long positions. Currently, the CCI indicator has entered the overbought area, which is a strong sell signal. But if the "bullish" mood in the market persists, no sell signal will lead to a decline. We have seen many such signals recently. Now the euro currency is trading in the style of bitcoin. On the 24-hour TF, the pair is again trying to consolidate above the 50.0% Fibonacci level, which will succeed this time.
Inflation has decreased, but only some things are straightforward. So, the consumer price index in March in the US fell to 5%, although forecasts predicted a drop to a maximum of 5.2%. And the market reacted to the core inflation indicator, ignoring the base one, which grew by 0.1%. We have repeatedly said that traders now interpret any report against the dollar, which leads to its constant decline. We also said that we do not believe in a higher value for core inflation at the Fed, but under current circumstances, core inflation is already higher than the main one. The US currency could have avoided falling yesterday, but why avoid it if you can follow the trend? A sharp drop in core inflation means the Fed may pause rate hikes as early as May. Of course, inflation will not fall by 1% every month. Thus, by the end of the year, the Fed may raise the rate once or twice more. However, the ECB will tighten monetary policy more strongly, so the European currency may show growth based on this factor. And if we close our eyes to all other factors.
What is the bottom line? Only that the euro is growing again. It is difficult to say how long this growth will continue because the market needs to pay attention to the fundamental and macroeconomic backgrounds. Therefore, as before, we advise treating all sell signals with caution. But at the same time, the baseless growth of the pair may also end at any moment, so you need to be extremely careful when buying. It is best to trade intraday now to react quickly to market changes. A few important events will occur this week, so the "bullish" sentiment may persist in the following days. But a rollback down should also happen. This is a divergence if the pair grows and the CCI indicator does not. Then it will be necessary to wait for the next entry of the indicator into the area above 250.
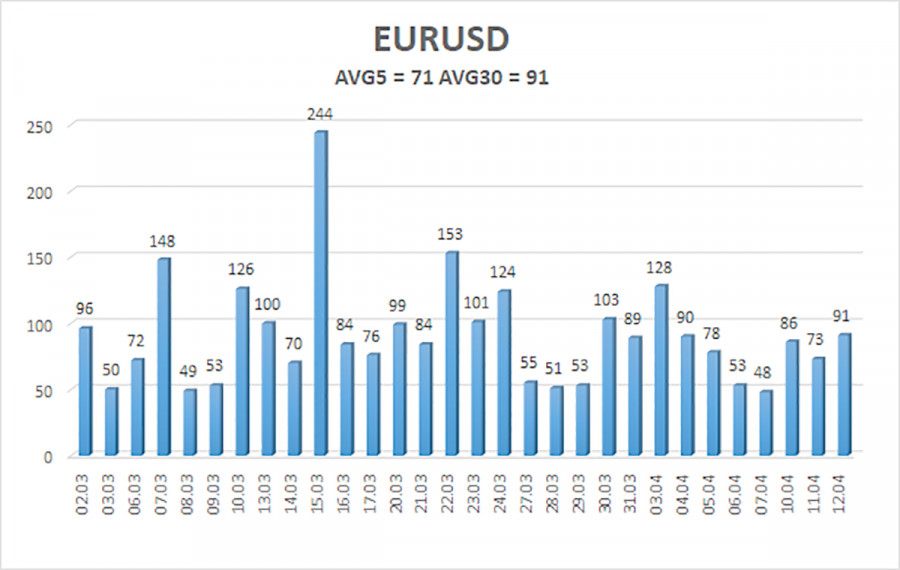
The average volatility of the euro/dollar currency pair for the last five trading days as of April 13 is 71 points and is characterized as "average." Thus, we expect the pair to move between 1.0922 and 1.1064 on Thursday. The reversal of the Heiken Ashi indicator back down will indicate a new round of downward movement.
Nearest support levels:
S1 – 1.0925
S2 – 1.0865
S3 – 1.0803
Nearest resistance levels:
R1 – 1.0986
R2 – 1.1047
R3 – 1.1108
Trading recommendations:
The EUR/USD pair has consolidated back above the moving average line. You can stay in long positions with targets of 1.1047 and 1.1064 until the Heiken Ashi indicator reverses. Short positions can be opened after the price consolidates below the moving average, with targets of 1.0864 and 1.0803.
Explanation of illustrations:
Linear regression channels - help determine the current trend. The trend is strong now if both are directed in the same direction.
Moving average line (settings 20,0, smoothed) - determines the short-term tendency and direction in which trading should be conducted now.
Murrey levels - target levels for movements and corrections.
Volatility levels (red lines) - the probable price channel in which the pair will spend the next day, based on the current volatility indicators.
CCI indicator - its entry into the oversold area (below -250) or overbought area (above +250) means a trend reversal in the opposite direction is approaching.


