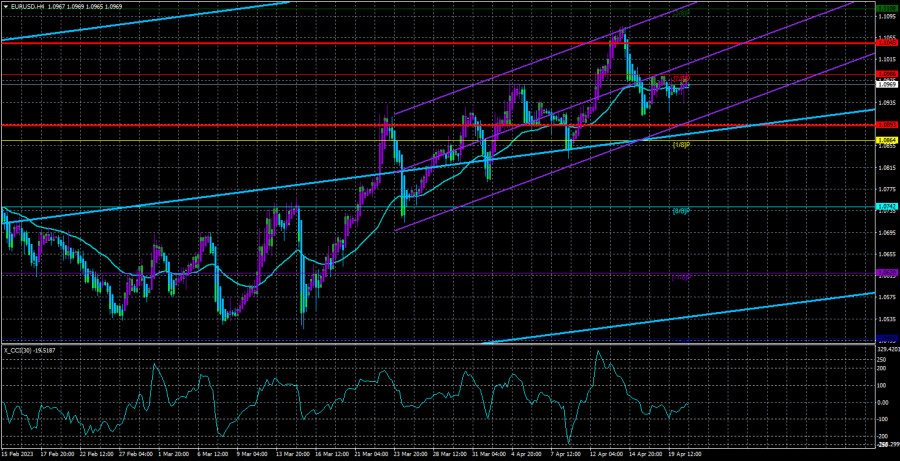
The EUR/USD currency pair completely stopped moving on Thursday. If there were incomprehensible movements that only confused the technical picture for several days before that, there were no movements at all yesterday. The price, which had been exactly on the moving average line all day, is now directed sideways. The fact that the pair closed a few points above the moving average at the end of the day does not matter. A strong upward trend remains, but the pair still desperately does not want to correct it, and we still wonder what makes the market keep up high demand for the euro currency. Another, already the fourth in a row, consolidation below the moving average did not lead to any downward movement. We believe that even those new to the market are already asking, "What is happening?"
The technical picture on the 24-hour TF is no better. The pair has consolidated above the important Fibonacci level of 50.0%, and that's it. Of course, it can continue to move up today or next week, but on what fundamental basis? How much more does the market intend to buy if there are no reasons for it? We have noted that the ECB rate will grow stronger than the Fed rate in 2023, but the market has long worked out this point. Otherwise, on what basis did the euro currency show growth of 550 points? In general, whatever it is, the European currency has already grown too much and is overbought, and the upward movement is inertial.
Hawkish expectations are growing, but what's the use?
There were no interesting reports or interesting events yesterday. By "interesting," we mean only those data that can affect traders' sentiment. Almost every week, we witness about 20 speeches by ECB and Fed representatives, but only 1-2 can provoke a reaction. Therefore, we do not consider James Bullard's next speech important. The same applies to reports on unemployment benefit claims or the Philadelphia business activity index. However, it is also not worth passing by all the events, as they help to form the correct expectations and background for the pair. Unfortunately, it is unlikely to be the case now, as the pair has been moving in only one direction for over a month. And during this time, a lot of information was received, some of which supported the US dollar. But we did not see any dollar growth because the market only interprets everything in favor of the euro.
Given the current state of the labor market, Mr. Bullard claimed yesterday that the US economy could avoid a recession. He said that markets are now pricing in a high probability of an economic downturn, but these expectations are mistaken. He also stated that the rate should be in the 5.5–5.75% range, which implies three more rate hikes, not one. It should be noted that most monetary committee members do not support Bullard's "ultra-hawkish" view. Most officials believe it is appropriate to raise the rate once in May, then take a break until the end of the year. It should also be noted that Bullard does not have the opportunity to influence the rate this year, and even if he did, he would be in the minority. The market has already significantly tightened its rate expectations by the end of the year. Just a month ago, it was expected that the beginning of monetary policy would ease by 1% at the end of 2023. Now it is pricing in a maximum of one decrease at the end of the year. As we can see, all this information does not help the dollar, as the market continues to "close its eyes" to everything that supports the US currency. All sell signals should still be treated cautiously, but remember that the euro currency can collapse downward at any moment.

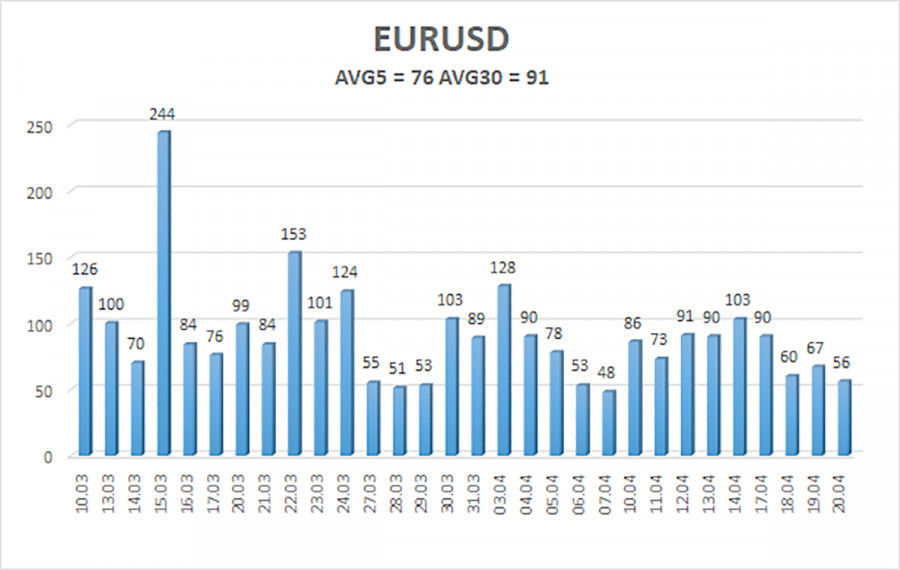
The average volatility of the EUR/USD currency pair for the last five trading days as of April 21 is 76 points and is characterized as "average." Thus, we expect the pair to move between 1.0893 and 1.1045 on Friday. A reversal of the Heiken Ashi indicator back down will indicate a possible resumption of the downward movement.
Nearest support levels:
S1 – 1.0864
S2 – 1.0742
S3 – 1.0620
Nearest resistance levels:
R1 – 1.0986
R2 – 1.1108
R3 – 1.1230
Trade recommendations:
The EUR/USD pair has begun its long-awaited correction. However, the pair is currently almost immobilized and in a flat. Trading can be done based on the reversal of the Heiken Ashi indicator, but it is best to trade on the youngest TF or wait for the flat to end.
Explanations for illustrations:
Linear regression channels - help determine the current trend. If both are directed in one direction, the trend is strong now.
Moving average line (settings 20.0, smoothed) - determines the short-term trend and direction in which trading should be conducted now.
Murray levels - target levels for movements and corrections.
Volatility levels (red lines) - the probable price channel in which the pair will spend the next day, based on the current volatility indicators.
CCI indicator - its entry into the oversold area (below -250) or overbought area (above +250) means a trend reversal in the opposite direction is approaching.


