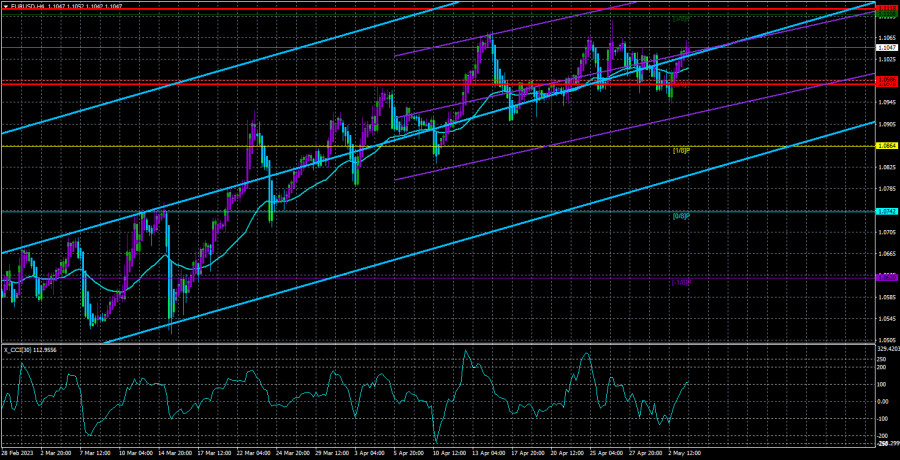
The EUR/USD currency pair traded higher most of Wednesday. We don't think such a move was logical, but we have long become accustomed to illogical moves. The market traded consciously on Monday and Tuesday, reacting to macroeconomic statistics as expected. However, overall, the pair's movement remains extremely flat, illogical, and chaotic. Looking at the illustration above, it becomes clear what we mean. The pair has been in a flat state for several weeks in a row. Moreover, this is not a classic flat where the sideways channel has clear boundaries between which the pair "dances." In our case, there is only one upper boundary – the 1.1065 level – from which the price has bounced back three times, but the lower boundary is quite blurred. One could even assume that in such an absurd way, the pair tries to complete the formation of an ascending trend that has lasted for more than two months without a noticeable correction. Assuming the upward trend is still in place, it weakens with each passing day. In the last few weeks, the European currency has not advanced upward at all.
It is worth noting that in this article, we will not discuss the results of the Fed meeting nor all the movements after their announcement. We do this every time because we believe the market trades on emotions at such moments, and the movements are often illogical. After some time, the market calms down, and the movements that occur are no longer considered. The pair may show strong growth, but the next day it will no longer mean the upward trend will continue. Generally, it is much better to wait one or two days for market participants to "digest" all the received information and only then conclude. Thus, the results of the Fed meeting will be summarized tomorrow. The same applies to today's results of the ECB meeting.
The ECB is likely to raise the rate by 0.25%.
It should be noted right away that before each meeting in the last year and a half, everyone actively predicts how the rate will change and what the rhetoric of the head of a particular bank will be. We believe that this is pointless. Conclusions and assumptions can be made based on inflation and GDP reports; lately, they have not shown significant changes in the European Union. The EU economy is still near zero growth, and inflation rose again in April after a March drop to 1.6%. The core inflation indicator has decreased for the first time in the last year, but only by 0.1%. This could be just a coincidence. Thus, the ECB will try to balance between economic growth and inflation, which is neither a secret nor news to anyone.
We are confident that within the ECB's Monetary Committee, there will be officials who will vote for the most "rigid" tightening option, and there will also be those who prefer to raise the rate by 0.25%. It is impossible to guess how much the rate will eventually be raised. Of course, if it increases by 0.5%, the European currency will be able to continue growing, but where will it end up after the Fed meeting and before the ECB meeting? 100 points lower than the current levels, then its growth will not affect the recent technical picture expressed by the flat. The market reaction can be absolutely anything. It is not advisable to base trading decisions on the ECB and Fed's decisions within one day. We suggest observing market behavior today and then drawing conclusions. After all, the European currency remains extremely overbought and should fall under any decisions of the Fed and ECB. The CCI indicator has already entered the overbought area twice. The upward momentum has slowed to almost zero. The pair remains very high and needs a strong correction, but it hasn't started so far. Although there are no specific sell signals, everything shows that the pair should move strongly to the south.
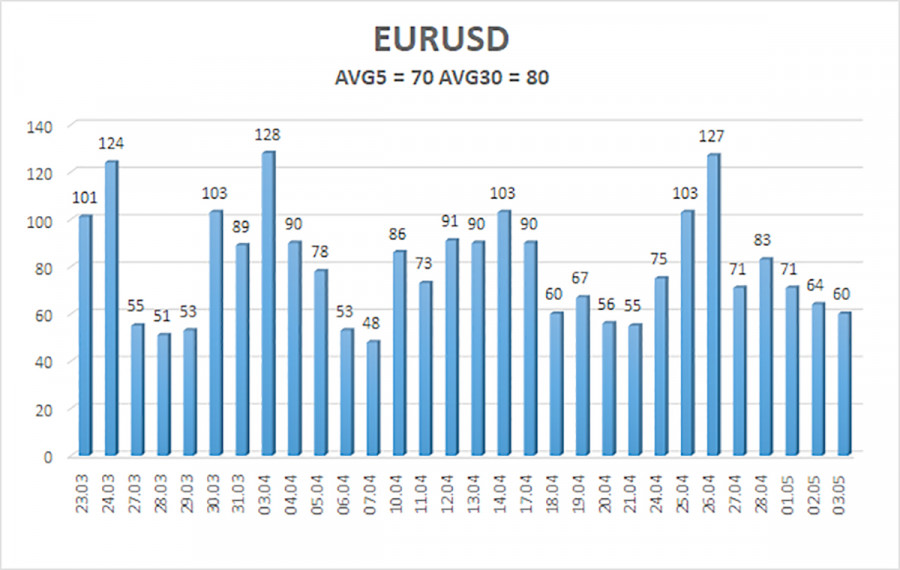
The average volatility of the EUR/USD currency pair over the last five trading days as of May 4 was 70 points, characterized as "average." Thus, we expect the pair to move between 1.0978 and 1.1118 on Thursday. A reversal of the Heiken Ashi indicator back down will indicate a new wave of downward movement.
Nearest support levels:
S1 – 1.0986
S2 – 1.0864
S3 – 1.0742
Nearest resistance levels:
R1 – 1.1108
R2 – 1.1230
R3 – 1.1353
Trading recommendations:
The EUR/USD pair is trying to resume its upward movement again. Currently, the movement is more horizontal, so trading can be done only based on reversals of the Heiken Ashi indicator. Or on the youngest timeframes, where at least intraday trends can be captured.
Explanations for illustrations:
Linear regression channels - help determine the current trend. If both are directed in one direction, the trend is strong now.
Moving average line (settings 20.0, smoothed) - determines the short-term trend and direction in which trading should be conducted now.
Murray levels - target levels for movements and corrections.
Volatility levels (red lines) - the probable price channel in which the pair will spend the next day, based on the current volatility indicators.
CCI indicator - its entry into the oversold area (below -250) or the overbought area (above +250) means that a trend reversal in the opposite direction is approaching.


