empty
13.11.2023 08:35 AM
Outlook for GBP/USD on November 13. COT report. Important data couldn't help the pound

Analysis of GBP/USD 5M

This image is no longer relevant

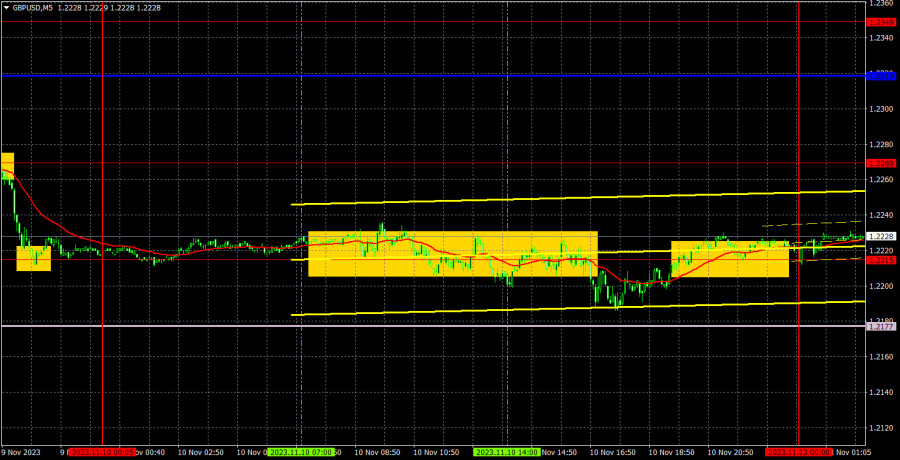
GBP/USD also traded with low volatility on Friday, mainly sideways. The only difference is that the British pound had two important reports at its disposal, which could have slightly stirred the market. However, the values of these reports turned out to be neutral and had no impact on the pair's movement. The UK's GDP remained unchanged in the third quarter, and industrial production volume in September also remained unchanged. In general, there was nothing to react to. Like the euro, the pound is currently between the Senkou Span B and Kijun-sen lines, maintaining the possibility of continuing both downward and upward movements. We are expecting a downward movement, but in order for that to happen this week, the pair must overcome the Senkou Span B.

There is no point in considering Friday's trading signals. The pair moved along the level of 1.2215 throughout the day, and it only managed to move away from it once. That happened almost in the evening when it was clear that there would be no significant movements. Therefore, the best decision was to stay out of the market on Friday.

COT report:

This image is no longer relevant

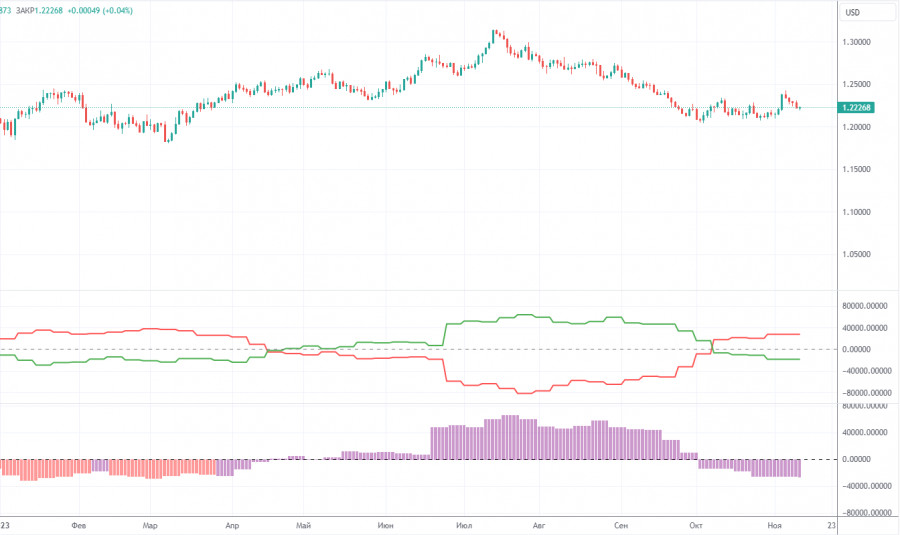
COT reports on the British pound also align perfectly with what's happening in the market. According to the latest report on GBP/USD, the non-commercial group closed 3,400 long positions and 1,700 short ones. Thus, the net position of non-commercial traders decreased by another 1,700 contracts in a week. The net position indicator has been steadily rising over the past 12 months, but it has been firmly decreasing over the past three months. The British pound is also losing ground. We have been waiting for many months for the sterling to reverse downwards. Perhaps GBP/USD is at the very beginning of a prolonged downtrend. At least in the coming months, we do not see significant prospects for the pound to rise, and even if we're currently witnessing a corrective phase, it could persist for several months.

The British pound has surged by a total of 2,800 pips from its absolute lows reached last year, which is an enormous increase. Without a strong downward correction, a further upward trend would be entirely illogical (if it is even planned). We don't rule out an extension of an uptrend. We simply believe that a substantial correction is needed first, and then we should assess the factors supporting the US dollar and the British pound. A correction to the level of 1.1844 would be enough to establish a fair balance between the two currencies. The non-commercial group currently holds a total of 63,700 longs and 85,800 shorts. The bears have been holding the upper hand in recent months, and we believe this trend will continue in the near future.

Analysis of GBP/USD 1H

This image is no longer relevant

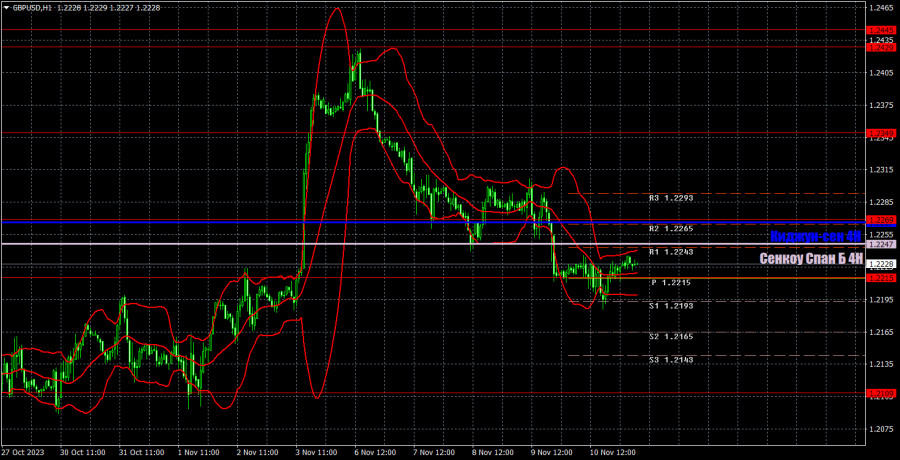
On the 1H chart, GBP/USD has finally formed an upward movement, which could serve as a convincing conclusion to the entire bullish correction, which lasted for more than a month. The pair has started to fall, and on the hourly chart, it surpassed the Senkou Span B line. Therefore, the pound may fall further, according to our expectations and calculations.

As of November 13, we highlight the following important levels: 1.1760, 1.1874, 1.1927-1.1965, 1.2052, 1.2109, 1.2215, 1.2269, 1.2349, 1.2429-1.2445, 1.2520, 1.2605-1.2620, 1.2693. The Senkou Span B (1.2247) and Kijun-sen (1.2267) lines can also be sources of signals. Signals can be "bounces" and "breakouts" of these levels and lines. It is recommended to set the Stop Loss level to break-even when the price moves in the right direction by 20 pips. The Ichimoku indicator lines can move during the day, which should be taken into account when determining trading signals. The illustration also includes support and resistance levels that can be used to lock in profits from trades.

On Monday, there are no important events or reports scheduled in the UK or the US. Therefore, after a dull Friday, we can expect another boring Monday accompanied by sluggish movements and low volatility.

Description of the chart:

Support and resistance levels are thick red lines near which the trend may end. They do not provide trading signals;

The Kijun-sen and Senkou Span B lines are the lines of the Ichimoku indicator, plotted to the 1H timeframe from the 4H one. They provide trading signals;

Extreme levels are thin red lines from which the price bounced earlier. They provide trading signals;

Yellow lines are trend lines, trend channels, and any other technical patterns;

Indicator 1 on the COT charts is the net position size for each category of traders;

Indicator 2 on the COT charts is the net position size for the Non-commercial group.

Paolo Greco,
الخبير التحليلي لدى شركة إنستافوركس
© 2007-2025
حدد الإطار الزمني
5
د
15
د
30
د
1
س
4
ساعات
1
يوم
1
أسبوع
كسب عائد من تغيرات أسعار العملات المشفرة مع إنستافوركس.
قم بتحميل منصة التداول ميتاتريدر 4 وافتح أول صفقة.
  • Grand Choice
    Contest by
    InstaForex
    InstaForex always strives to help you
    fulfill your biggest dreams.
    انضم إلى المسابقة

المقالات الموصى بها

كيفية تداول زوج الجنيه الإسترليني/الدولار الأمريكي في 27 مارس؟ نصائح بسيطة وتحليل التداول للمبتدئين

في يوم الأربعاء، أظهر زوج الجنيه الإسترليني/الدولار الأمريكي حركة هبوطية تتماشى أخيرًا مع الخلفية الاقتصادية الكلية. خلال اليوم، كان المتداولون مهتمين بتقريرين. في المملكة المتحدة، تم نشر تقرير التضخم، بينما

Paolo Greco 05:42 2025-03-27 UTC+2

كيفية تداول زوج اليورو/الدولار الأمريكي في 27 مارس؟ نصائح بسيطة وتحليل التداول للمبتدئين

في يوم الأربعاء، واصل زوج العملات اليورو/الدولار الأمريكي انخفاضه البطيء. إن تراجع اليورو يبدو منطقيًا إلى حد ما، على الرغم من أن المتداولين يواصلون تجاهل معظم الأحداث الاقتصادية الكلية. السوق

Paolo Greco 05:42 2025-03-27 UTC+2

توصيات وتحليل التداول لزوج الجنيه الإسترليني/الدولار الأمريكي في 27 مارس: تراجع الجنيه، لكن لم يتغير شيء

تداول زوج العملات GBP/USD بانخفاض يوم الأربعاء. كنا قد حذرنا من أن الزوج كان يتأرجح مؤخرًا مثل البندول. كان الجنيه يرتفع يوم الثلاثاء، لذا كان من الممكن أن ينخفض بسرعة

Paolo Greco 03:06 2025-03-27 UTC+2

توصيات وتحليل التداول لزوج اليورو/الدولار الأمريكي في 27 مارس: السوق ليست في عجلة من أمرها

تداول زوج العملات EUR/USD بخسائر طفيفة طوال يوم الأربعاء، بينما يظل الاتجاه العام على الإطار الزمني للساعة هابطًا بعد خروج السعر من القناة الصاعدة. تراجع اليورو ضعيف، مع ارتدادات متكررة،

Paolo Greco 03:06 2025-03-27 UTC+2

GBP/USD: خطة التداول للجلسة الأمريكية في 26 مارس (مراجعة التداولات الصباحية)

في توقعاتي الصباحية، قمت بتسليط الضوء على مستوى 1.2926 وخططت لاتخاذ قرارات التداول بناءً عليه. دعونا نلقي نظرة على الرسم البياني لمدة 5 دقائق ونحلل ما حدث. قدم الاختراق وإعادة

Miroslaw Bawulski 17:24 2025-03-26 UTC+2

EUR/USD: خطة التداول للجلسة الأمريكية في 26 مارس (مراجعة التداولات الصباحية)

في توقعاتي الصباحية، قمت بتسليط الضوء على مستوى 1.0780 وخططت لاتخاذ قرارات دخول السوق بناءً عليه. دعونا نلقي نظرة على الرسم البياني لمدة 5 دقائق ونحلل ما حدث. على الرغم

Miroslaw Bawulski 17:21 2025-03-26 UTC+2

كيفية تداول زوج الجنيه الإسترليني/الدولار الأمريكي في 26 مارس؟ نصائح بسيطة وتحليل التداول للمبتدئين

في يوم الثلاثاء، تداول زوج الجنيه الإسترليني/الدولار الأمريكي بزيادة طفيفة، لكن الحركة العامة في الأسابيع الأخيرة تشبه بشكل متزايد سوقًا مسطحًا. القناة الجانبية المفترضة ليس لها حدود محددة بوضوح،

Paolo Greco 05:55 2025-03-26 UTC+2

كيفية تداول زوج اليورو/الدولار الأمريكي في 26 مارس؟ نصائح بسيطة وتحليل التداول للمبتدئين

في يوم الثلاثاء، واصل زوج العملات EUR/USD حركته الضعيفة نحو الانخفاض. يمكن ملاحظة ذلك في أي رسم بياني لأي إطار زمني، بعد ارتفاع قوي وطويل الأمد لليورو - والذي يمثل

Paolo Greco 05:55 2025-03-26 UTC+2

توصيات وتحليلات التداول لزوج الجنيه الإسترليني/الدولار الأمريكي في 26 مارس: الجنيه يواصل التأرجح

أظهر زوج العملات GBP/USD نموًا مرة أخرى يوم الثلاثاء. "مرة أخرى"، لأن جميع تحركات العملة البريطانية مؤخرًا تشبه "الأرجوحة" أو "الأفعوانية" - أولاً صعودًا، ثم هبوطًا. علاوة على ذلك،

Paolo Greco 02:40 2025-03-26 UTC+2

توصيات وتحليلات التداول لليورو/الدولار الأمريكي في 26 مارس: يواصل اليورو تراجعه البطيء

تداول زوج العملات EUR/USD بزيادات طفيفة فقط يوم الثلاثاء، لكن الاتجاه العام على الإطار الزمني الساعي لا يزال هابطًا بعد خروج السعر من القناة الصاعدة. تراجع اليورو ضعيف نسبيًا،

Paolo Greco 02:40 2025-03-26 UTC+2
لا تستطيع التحدث الآن؟
اطرح سؤالك في الدردشة.
Widget callback
 

Dear visitor,

Your IP address shows that you are currently located in the USA. If you are a resident of the United States, you are prohibited from using the services of InstaFintech Group including online trading, online transfers, deposit/withdrawal of funds, etc.

If you think you are seeing this message by mistake and your location is not the US, kindly proceed to the website. Otherwise, you must leave the website in order to comply with government restrictions.

Why does your IP address show your location as the USA?

  • - you are using a VPN provided by a hosting company based in the United States;
  • - your IP does not have proper WHOIS records;
  • - an error occurred in the WHOIS geolocation database.

Please confirm whether you are a US resident or not by clicking the relevant button below. If you choose the wrong option, being a US resident, you will not be able to open an account with InstaForex anyway.

We are sorry for any inconvenience caused by this message.