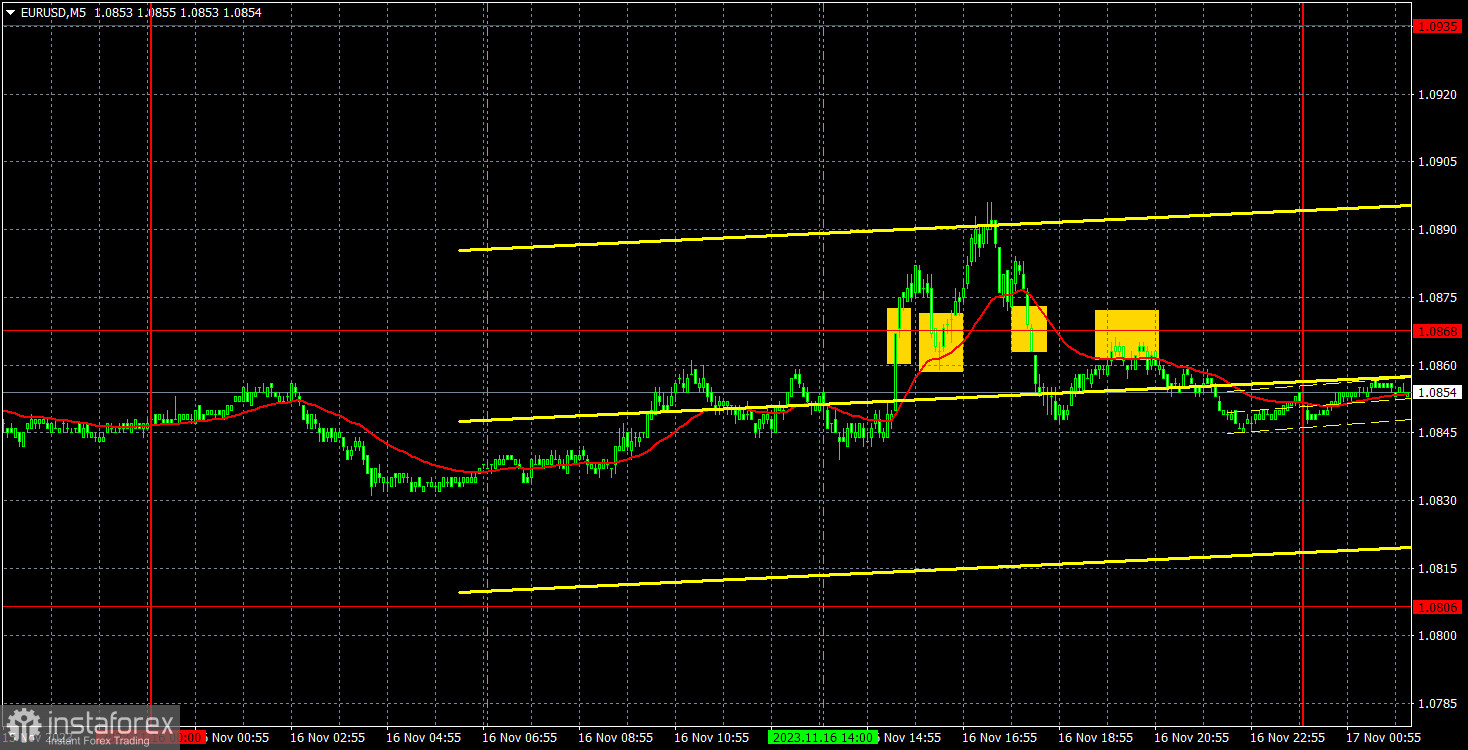
Analysis of EUR/USD 5M
EUR/USD tried to start a bearish correction on Thursday following its substantial growth on Tuesday, but once again, it was hindered by U.S. reports. This time, the U.S. released secondary reports, but they turned out to be weaker than expected, and the dollar fell. The drop was not significant, but its still a decline. The number of unemployment benefit claims was slightly higher than forecast, and industrial production contracted a bit more than expected. Therefore, we still expect a downtrend in the near future, but U.S. reports and news continue to prevent the market from selling the pair.
There were few trading signals on Thursday, and they were just adequate. Thanks to the same U.S. reports, the pair started to rise during the U.S. trading session, reached the level of 1.0868 and even managed to surpass it. After forming this signal, the price moved in the intended direction by 18 pips. This was enough to set a Stop Loss at breakeven for long positions, so the trade closed at zero profit when the next sell signal was formed. Traders could also execute this signal, but the price couldn't fall by more than 20 pips. Therefore, the second trade likely also closed at breakeven. Volatility was low again.
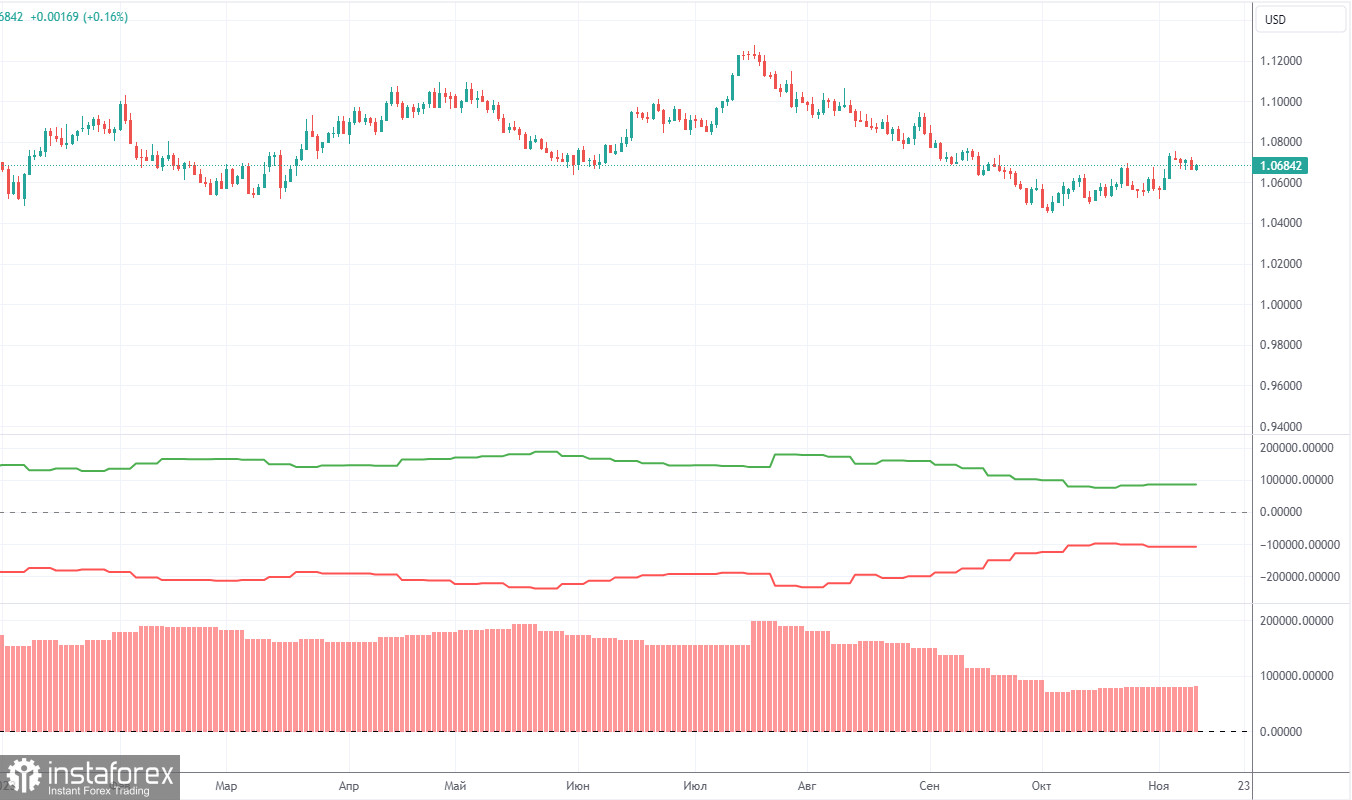
COT report:
On Friday, a new COT report for October 31st was released. Over the past 12 months, the COT report data has been consistent with what's happening in the market. The net position of large traders (the second indicator) began to rise back in September 2022, roughly at the same time that the euro started to rise. In the first half of 2023, the net position hardly increased, but the euro remained relatively high during this period. Only in the last three months, we have seen a decline in the euro and a drop in the net position, as we anticipated. Currently, the net position of non-commercial traders is still bullish and this trend is likely to lose momentum soon.
We have previously noted that the red and green lines have moved significantly apart from each other, which often precedes the end of a trend. This configuration persisted for over half a year, but ultimately, the lines have started moving closer to each other. Therefore, we still stick to the scenario that the upward trend is over. During the last reporting week, the number of long positions for the "non-commercial" group decreased by 4,700, while the number of short positions fell by 4,800. Consequently, the net position remained mostly unchanged. The number of BUY contracts is still higher than the number of SELL contracts among non-commercial traders by 82,000, but the gap is narrowing. In principle, it is now evident even without COT reports that the euro is set to extend its weakness. However, the corrective phase has not yet ended.
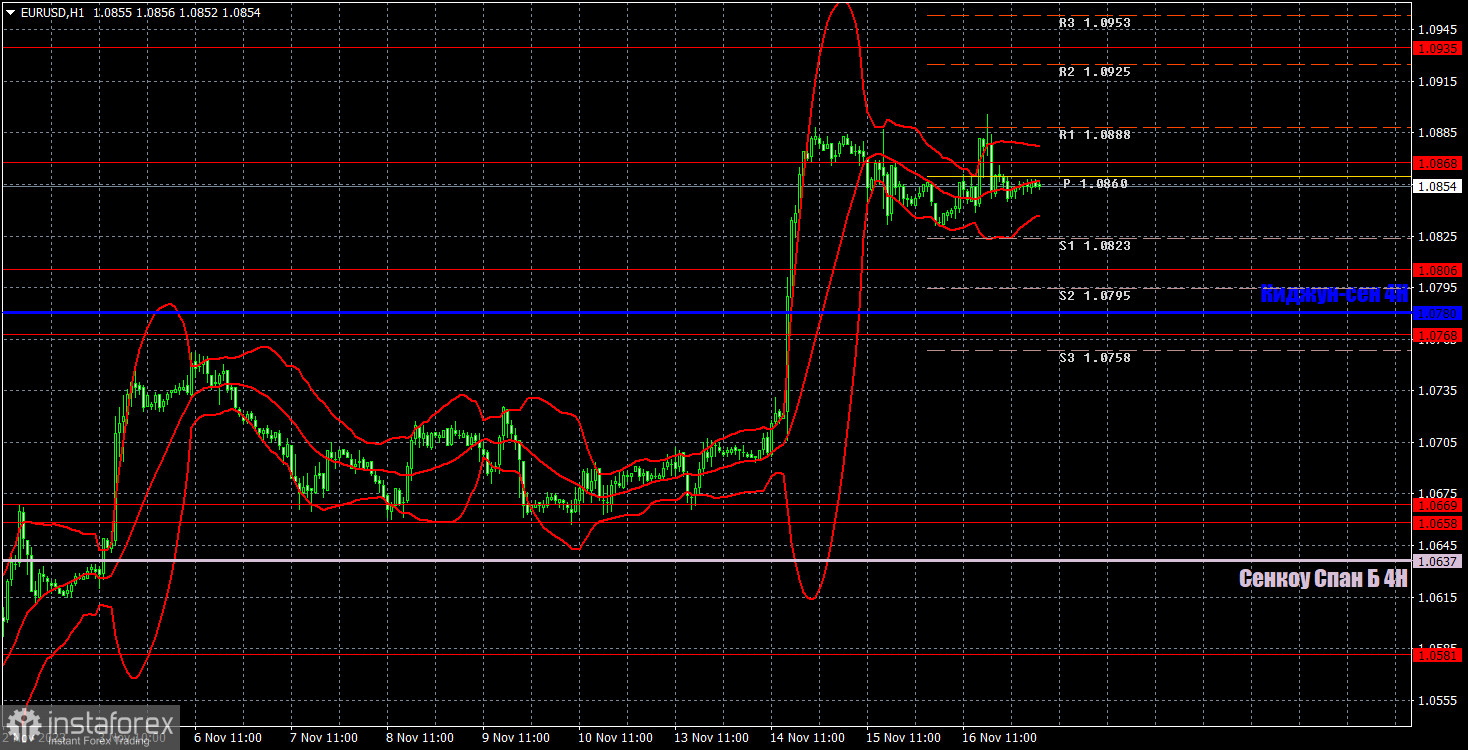
Analysis of EUR/USD 1H
On the 1-hour chart, the pair exhibited another corrective phase. Two out of the five phases in the current correction were triggered by weak U.S. reports. Therefore, for now, we can say that reports have been boosting the euro, U.S. data in particular, as the eurozone reports have been weak. For now, we need to wait for the pair to breach the Senkou Span B and Kijun-sen lines in order to identify the recommencement of the downtrend in the medium-term.
On November 17, we highlight the following levels for trading: 1.0485, 1.0530, 1.0581, 1.0658-1.0669, 1.0768, 1.0806, 1.0868, 1.0935, 1.1012, 1.1092, as well as the Senkou Span B (1.0637) and Kijun-sen (1.0780) lines. The Ichimoku indicator lines can shift during the day, so this should be taken into account when identifying trading signals. There are also auxiliary support and resistance levels, but signals are not formed near them. Signals can be "bounces" and "breakouts" of extreme levels and lines. Don't forget to set a breakeven Stop Loss if the price has moved in the right direction by 15 pips. This will protect against potential losses if the signal turns out to be false.
On Friday, the EU's docket will feature the Harmonized Index of Consumer Prices, and a speech of European Central Bank President Christine Lagarde. We do not expect a strong market reaction from either event. The second estimate is almost always the same as the first, and Lagarde has already spoken this week and she didn't share any important information. Meanwhile, the U.S. will release a minor report on the number of building permits.
Description of the chart:
Support and resistance levels are thick red lines near which the trend may end. They do not provide trading signals;
The Kijun-sen and Senkou Span B lines are the lines of the Ichimoku indicator, plotted to the 1H timeframe from the 4H one. They provide trading signals;
Extreme levels are thin red lines from which the price bounced earlier. They provide trading signals;
Yellow lines are trend lines, trend channels, and any other technical patterns;
Indicator 1 on the COT charts is the net position size for each category of traders;
Indicator 2 on the COT charts is the net position size for the Non-commercial group.