empty
05.01.2024 06:09 PM
EUR/USD. Analysis for January 5th. European inflation rises again

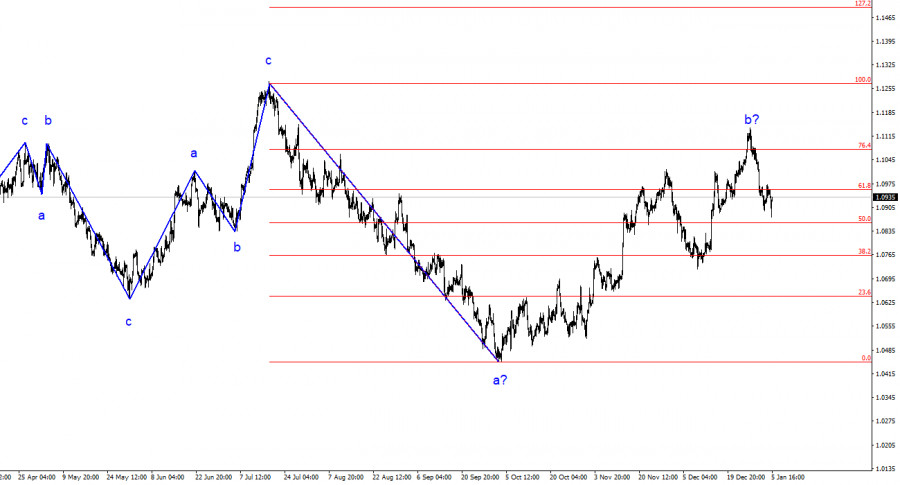
The wave analysis of the 4-hour chart for the euro/dollar pair has become more complex. Over the past year, we have observed only three wave structures that constantly alternate with each other. Currently, the construction of another three-wave decline continues. The presumed wave 1 has been completed, but wave 2 or b has become more complex three or four times, and there are no guarantees that it won't become even more complex.

Although the news background cannot be considered "supportive of the European currency," the market always finds new reasons to increase demand for the pair. Such a situation is not normal. Even if the upward segment of the trend resumes, its internal structure will become completely unreadable.

The internal wave analysis of the presumed wave 2 or b has changed. Since the last downward wave turned out to be disproportionately large, I now interpret it as a wave b. If this is the case, wave c is currently being constructed, and the entire wave 2 or b can still end at any moment (or may have already ended). The current retreat from the reached highs looks convincing, so we can expect a transition to wave 3 or c construction.

Eurozone inflation followed Germany's lead.

On Friday, the euro/dollar currency pair saw a 20 basis point decline. However, such a statement should not confuse my readers – during the day, the amplitude of movements was quite high, and quotes changed direction several times. In the first half of the day, there was a decline. As expected, the report on European inflation showed an acceleration in the pace of price growth, but it was less than anticipated. The market's expectation-to-reality mismatch was only 0.1%: 2.9% y/y vs. 3.0% y/y.

However, technically, inflation accelerated less, which implies a drop in the euro since the market expected more. If inflation had risen by more than 3%, it would have meant that the ECB would postpone the start of the monetary policy tightening procedure indefinitely. The rise in inflation to 2.9% essentially means the same thing, but here, the expectation-to-reality ratio played a role. Since reality turned out to be less severe, the market had a reason to reduce demand for the euro.

A couple of hours ago, the Nonfarm Payrolls and unemployment reports were released in America. These two reports can unequivocally be considered in favor of the dollar, but the market again failed or did not want to support the construction of a potential wave 3 or c. The US dollar rose for a very short period, then immediately retreated. An unsuccessful attempt to break through the 1.0881 level, corresponding to 61.8% Fibonacci, played a role.

This image is no longer relevant

General conclusions.

Based on the analysis conducted, the construction of a bearish wave set continues. The targets around the 1.0463 mark have been perfectly worked out, and an unsuccessful attempt to break this level indicated a transition to the construction of a corrective wave. Wave 2 or b has taken on a completed form, so I expect the construction of an impulsive downward wave 3 or c with a significant decline in the pair soon. The unsuccessful attempt to break through the 1.1125 level, corresponding to 23.6% Fibonacci, indicated the market's readiness for selling.

On the larger wave scale, we can see that the construction of corrective wave 2 or b continues, which is no longer than 61.8% Fibonacci from the first wave. As I have already mentioned, this is not critical, and the scenario with the construction of wave 3 or c and a decline in the pair below the 1.04 level remains in force.

Chin Zhao,
الخبير التحليلي لدى شركة إنستافوركس
© 2007-2025
حدد الإطار الزمني
5
د
15
د
30
د
1
س
4
ساعات
1
يوم
1
أسبوع
كسب عائد من تغيرات أسعار العملات المشفرة مع إنستافوركس.
قم بتحميل منصة التداول ميتاتريدر 4 وافتح أول صفقة.
  • Grand Choice
    Contest by
    InstaForex
    InstaForex always strives to help you
    fulfill your biggest dreams.
    انضم إلى المسابقة

المقالات الموصى بها

تحليل يورو/دولار أمريكي في 25 يونيو 2025

نمط الموجة على الرسم البياني لمدة 4 ساعات لزوج اليورو/الدولار الأمريكي يستمر في الإشارة إلى تشكيل جزء من الاتجاه الصعودي. حتى 28 فبراير، عندما بدأ الدولار الأمريكي في الانخفاض،

Chin Zhao 19:10 2025-06-25 UTC+2

تحليل GBP/USD في 24 يونيو 2025

نمط الموجة لزوج الجنيه الإسترليني/الدولار الأمريكي يستمر في الإشارة إلى تشكيل تسلسل موجة دافعة صاعدة. نمط الموجة يكاد يكون مطابقًا لنمط زوج اليورو/الدولار الأمريكي، حيث يظل المحرك الرئيسي

Chin Zhao 19:35 2025-06-24 UTC+2

تحليل EUR/USD في 24 يونيو 2025

يستمر نمط الموجة على الرسم البياني لليورو/الدولار الأمريكي لمدة 4 ساعات في الإشارة إلى تشكيل جزء من الاتجاه الصاعد. حدث هذا التحول فقط بسبب السياسة التجارية الجديدة للولايات المتحدة

Chin Zhao 19:29 2025-06-24 UTC+2

تحليل EUR/USD في 23 يونيو 2025

يستمر نمط الموجة في الرسم البياني لليورو/الدولار الأمريكي لمدة 4 ساعات في الإشارة إلى تطور جزء من الاتجاه الصاعد. حدث هذا التحول بشكل حصري بسبب السياسة التجارية الجديدة للولايات المتحدة

Chin Zhao 19:08 2025-06-23 UTC+2

التوقعات الأسبوعية بناءً على تحليل الموجات المبسط لزوج العملات الجنيه الإسترليني/الدولار الأمريكي، الدولار الأسترالي/الدولار الأمريكي، الدولار الأمريكي/الفرنك السويسري، اليورو/الين الياباني، اليورو/الجنيه الإسترليني، ومؤشر الدولار الأمريكي — 23 يونيو

في الأيام القادمة، من المحتمل أن يحدث تراجع هبوطي في أسعار الجنيه الإسترليني، قد يصل إلى منطقة الدعم المحسوبة. بعد الوصول إلى هذا المستوى، من المرجح أن تتحرك الأسعار بشكل

Isabel Clark 11:14 2025-06-23 UTC+2

التوقعات الأسبوعية بناءً على تحليل الموجات المبسط لزوج اليورو/الدولار الأمريكي، الدولار الأمريكي/الين الياباني، الجنيه الإسترليني/الين الياباني، الدولار الأمريكي/الدولار الكندي، الدولار النيوزيلندي/الدولار الأمريكي، والذهب — 23 يونيو

التوقعات للأيام القادمة: من المتوقع أن يستمر التحرك الجانبي. بالقرب من منطقة الدعم المتوقعة، هناك احتمال كبير لحدوث توقف وتشكيل ظروف للانعكاس. من المرجح أن يحدث تحرك صعودي في الأسعار

Isabel Clark 11:09 2025-06-23 UTC+2

تحليل GBP/USD في 17 يونيو 2025

يستمر نمط الموجة على مخطط GBP/USD في الإشارة إلى تشكيل نمط موجة دافعة صاعدة. يتشابه تخطيط الموجة بشكل كبير مع EUR/USD، حيث أن المحرك الرئيسي هنا هو الدولار الأمريكي. الطلب

Chin Zhao 21:24 2025-06-17 UTC+2

تحليل EUR/USD في 17 يونيو 2025

نمط الموجة على الرسم البياني لليورو/الدولار الأمريكي لمدة 4 ساعات يستمر في الإشارة إلى تطور جزء من الاتجاه الصاعد. حدث هذا التحول فقط بسبب السياسة التجارية الجديدة للولايات المتحدة

Chin Zhao 21:18 2025-06-17 UTC+2

تحليل الجنيه الإسترليني/الدولار الأمريكي في 16 يونيو 2025

نمط الموجة لزوج الجنيه الإسترليني/الدولار الأمريكي يستمر في الإشارة إلى تطور اتجاه صعودي اندفاعي. نمط الموجة يكاد يكون مطابقًا لنمط زوج اليورو/الدولار الأمريكي، حيث أن المحرك الرئيسي للحركة هو الدولار

Chin Zhao 19:48 2025-06-16 UTC+2

تحليل يورو/دولار أمريكي في 16 يونيو 2025

نمط الموجة على الرسم البياني لليورو/الدولار الأمريكي لمدة 4 ساعات يستمر في الإشارة إلى تطور جزء من الاتجاه الصاعد. حدث هذا التحول فقط بسبب السياسة التجارية الجديدة للولايات المتحدة

Chin Zhao 19:45 2025-06-16 UTC+2
لا تستطيع التحدث الآن؟
اطرح سؤالك في الدردشة.
Widget callback
 

Dear visitor,

Your IP address shows that you are currently located in the USA. If you are a resident of the United States, you are prohibited from using the services of InstaFintech Group including online trading, online transfers, deposit/withdrawal of funds, etc.

If you think you are seeing this message by mistake and your location is not the US, kindly proceed to the website. Otherwise, you must leave the website in order to comply with government restrictions.

Why does your IP address show your location as the USA?

  • - you are using a VPN provided by a hosting company based in the United States;
  • - your IP does not have proper WHOIS records;
  • - an error occurred in the WHOIS geolocation database.

Please confirm whether you are a US resident or not by clicking the relevant button below. If you choose the wrong option, being a US resident, you will not be able to open an account with InstaForex anyway.

We are sorry for any inconvenience caused by this message.