Yesterday's trading on the main currency pair of the Forex market both began and ended with a decline, contrary to preliminary forecasts of a likely increase after pullbacks down. Well, in more detail, as promised yesterday, we will analyze smaller time intervals. However, for now, let's briefly talk about today's macroeconomic events. First of all, I would like to draw your attention again that the fundamental component is not always taken into account and recouped by the market. As another typical example of this factor, yesterday's data from the United States on the index of business activity in the manufacturing sector and construction costs can be cited. It is noteworthy that both indicators came out in the red zone, that is, worse than the forecast values. However, this did not prevent the US dollar from noticeably strengthening its position against the single European currency.
Retail sales data in Germany have already been published today, both seasonally adjusted and without taking into account those. Both indicators exceeded economists' expectations and turned out to be stronger than forecasts. Nevertheless, at this stage of time, it did not bring the European currency much-needed and significant support. And this is another example when the "foundation" is not completely and far from always taken into account by the market. Later, at 15:00 London time, data from the States on the level of vacancies and labor turnover will be released, and the production index of the Institute of Supply Management (ISM) will also be published. I can't say that these are very important indicators, but they can't be attributed to being too weak either. Let's see if they will have an impact on the price dynamics of EUR/USD, but for now we turn to the technical picture.
Daily
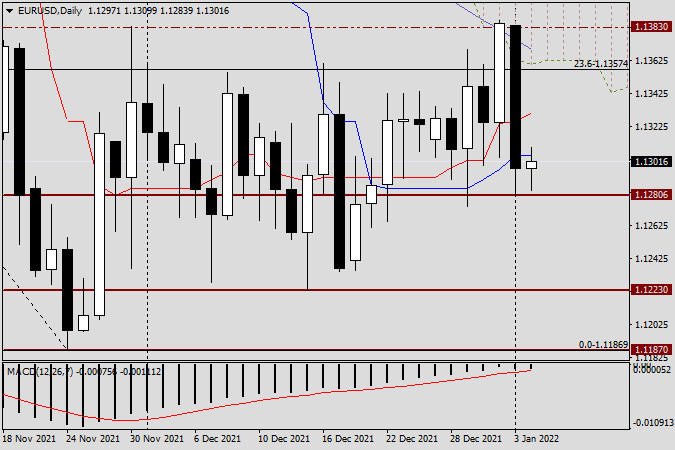
As already noted at the beginning of this article, on the first trading day of the new year, the pair showed a fairly strong bearish dynamic. Of course, you can always find some explanation for any price movement, whether it's the notorious COVID-19 strain called "Omicron" or a change in the yield of US treasuries, or some other supposedly significant reason. In my personal opinion, the main factor in yesterday's strengthening of the US dollar against the euro was (as most often happens) the technical component. And on the daily chart, at least three obstacles are clearly visible, which did not let the pair go higher and turned it in a southerly direction. First, this is the resistance level of 1.1383, over which the euro bulls failed to consolidate trading, which once again underlines the strength of this resistance of sellers. Second, the 50 simple moving average and the lower boundary of the daily cloud of the Ichimoku indicator played their role as resistance.
Another bearish positive moment was the closing of yesterday's trading below the red Tenkan line and the blue Kijun line of the Ichimoku indicator, which had previously, and more than once, provided EUR/USD with strong support. So, as a result of yesterday's not weak decline, the pair ended trading below the most important technical level of 1.1300. At the end of this article, the euro/dollar is trying to adjust to yesterday's decline and is strengthening slightly. If today's session closes above the Kijun and Tenkan lines, their breakdown can be considered false and prepare for another test for the breakdown of a strong resistance zone of 1.1383/85. Task No. 1 for players to lower the exchange rate will be to update yesterday's lows at 1.1280 and close trading under this support level, if this condition is met, the road will open for the euro/dollar to the levels of 1.1230, 1.1200 and, possibly, to the key support level of 1.1187.
H1
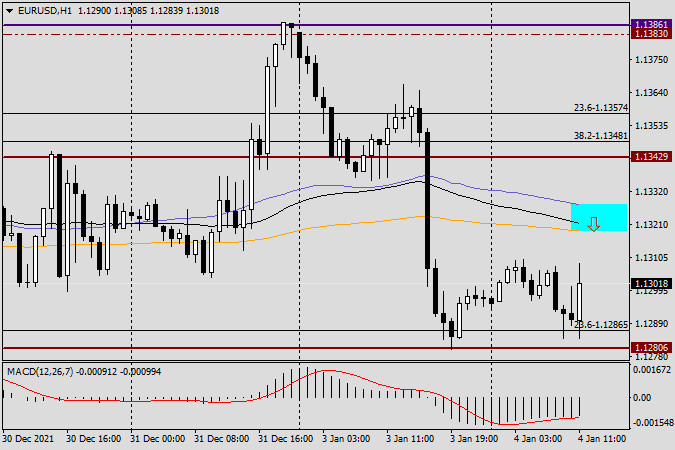
On the hourly chart, at the very end of the article, we observe a very active and quite strong growth. Most likely, the pair will rise to the moving averages used and broken the day before, which are in the circled zone 1.1319-1.1327. If a candle or a combination of bearish reversal candles appears in the selected zone on this or four-hour charts, it can be perceived as a signal to open sales. Given yesterday's strong decline and the closing of trading under the most important mark of 1.1300, in the current situation with purchases, it is better to wait and see how today's trading ends. I fully admit that taking into account the closing of today's session and the formed daily candle, we can get answers to our questions about the further direction of the quote. So far, somehow.


