empty
 
 
28.11.2023 10:11 AM
EUR/USD and GBP/USD: Trading plan for beginner traders on November 28, 2023

Details of the Economic Calendar on November 27

On Monday, the macroeconomic calendar was almost empty, and the only thing worth noting was the data on new home sales in the United States, where a decline of 5.6% was recorded. This indicator turned out to be negative for the country's economy.

Analysis of Trading Charts from November 27

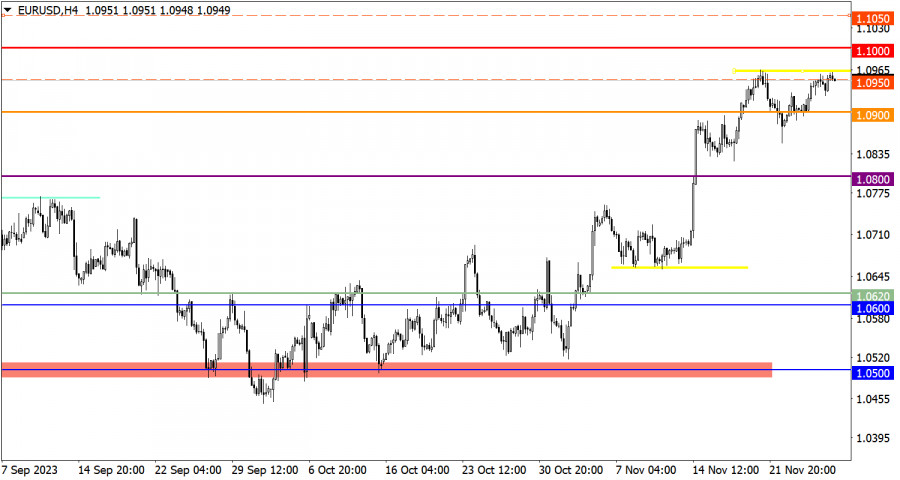
The EUR/USD currency pair approached the local high of the current upward cycle. This move led to a slight reduction in the volume of long positions, but the upward trend is still maintained in the market.

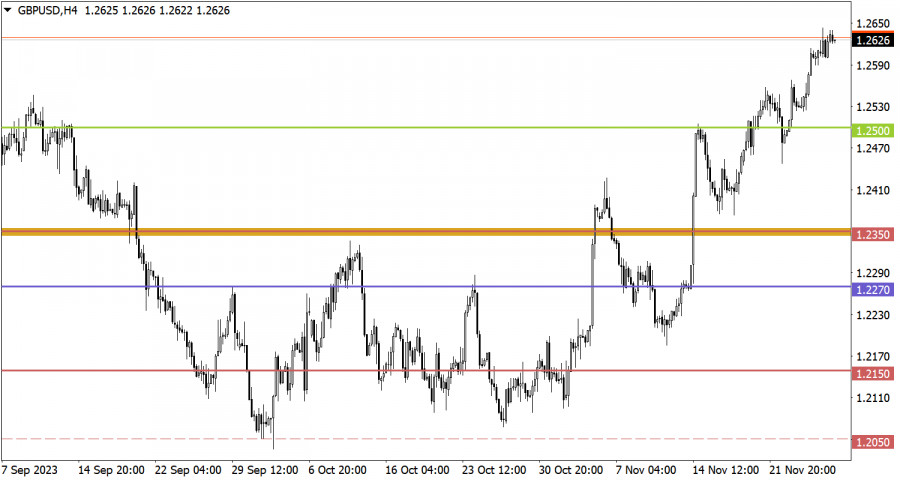
The GBP/USD pair again updated the local high in the current upward cycle. Since the beginning of November, the value of the British pound has strengthened by more than 4%, which is about 500 points.

This image is no longer relevant

Economic Calendar on November 28

Today, data on the House Price Index in the United States will be released, which is expected to rise by 0.4% (month-on-month). Considering the significant decrease in sales volumes, especially in the secondary market, the price increase may be considered more as a negative factor, hindering the real estate market's recovery. According to this logic, the U.S. dollar may come under pressure from sellers.

EUR/USD Trading Plan for November 28

In the current situation, price stabilization above the level of 1.0950 could well initiate an update of the local high. In perspective, such a movement may strengthen the euro towards the range of 1.1000/1.1050.

This image is no longer relevant

GBP/USD Trading Plan for November 28

Subsequent growth could well trigger a price movement towards the resistance level of 1.2700. It is worth noting that an increasing level of overbought conditions is already observed in the market, which could negatively impact the volume of long positions in the future.

This image is no longer relevant

What's on the charts

The candlestick chart type is white and black graphic rectangles with lines above and below. With a detailed analysis of each individual candle, you can see its characteristics relative to a particular time frame: opening price, closing price, intraday high and low.

Horizontal levels are price coordinates, relative to which a price may stop or reverse its trajectory. In the market, these levels are called support and resistance.

Circles and rectangles are highlighted examples where the price reversed in history. This color highlighting indicates horizontal lines that may put pressure on the asset's price in the future.

The up/down arrows are landmarks of the possible price direction in the future.

Gven Podolsky,
ইন্সটাফরেক্সের বিশ্লেষণ বিশেষজ্ঞ
© 2007-2024
EUR
Summary
ক্রয়
Urgency
1 দিন
Analytic
Vladislav Tukhmenev
Start trade
ইনস্টাফরেক্স দিয়ে ক্রিপ্টোমুদ্রা দর পরিবর্তনে আয় করুন।
মেটাট্রেডার 4 ডাউনলোড করে আপনার প্রথম ট্রেড চালু করুন।
  • Grand Choice
    Contest by
    InstaForex
    InstaForex always strives to help you
    fulfill your biggest dreams.
    প্রতিযোগীতায় অংশগ্রহণ করুন
  • চ্যান্সি ডিপোজিট
    আপনার অ্যাকাউন্টে $3,000 জমা করুন এবং $5000 এর অধিক নিন!
    চ্যান্সি ডিপোজিট প্রচারাভিযানে আমরা নভেম্বর $5000 লটারি করেছি! একটি ট্রেডিং অ্যাকাউন্টে $3,000 জমা করে এই অর্থ জেতার একটি সুযোগ নিন! এই শর্ত পূরণ করে, আপনি একজন অংশগ্রহণকারী হতে পারবেন।
    প্রতিযোগীতায় অংশগ্রহণ করুন
  • বুদ্ধিমত্তার সাথে ট্রেড করুন, ডিভাইস জিতুন
    আপনার অ্যাকাউন্টে কমপক্ষে $৫০০ টপ আপ করুন, প্রতিযোগিতার জন্য সাইন আপ করুন এবং মোবাইল ডিভাইস জেতার সুযোগ পান।
    প্রতিযোগীতায় অংশগ্রহণ করুন
  • ১০০% বোনাস
    আপনার ডিপোজিটের উপর ১০০% বোনাস পাওয়ার অনন্য সুযোগ
    বোনাস পান
  • ৫৫% বোনাস
    আপনার অ্যাকাউন্টে প্রতিটি ডিপোজিটের উপর ৫৫% বোনাসের জন্য আবেদন করুন
    বোনাস পান
  • ৩০% বোনাস
    প্রতিবার আপনার অ্যাকাউন্ট টপ আপ করার সময় ৩০% বোনাস নিন
    বোনাস পান

সুপারিশকৃত নিবন্ধ

এখন কথা বলতে পারবেন না?
আপনার প্রশ্ন জিজ্ঞাসা করুন চ্যাট.
Widget callback