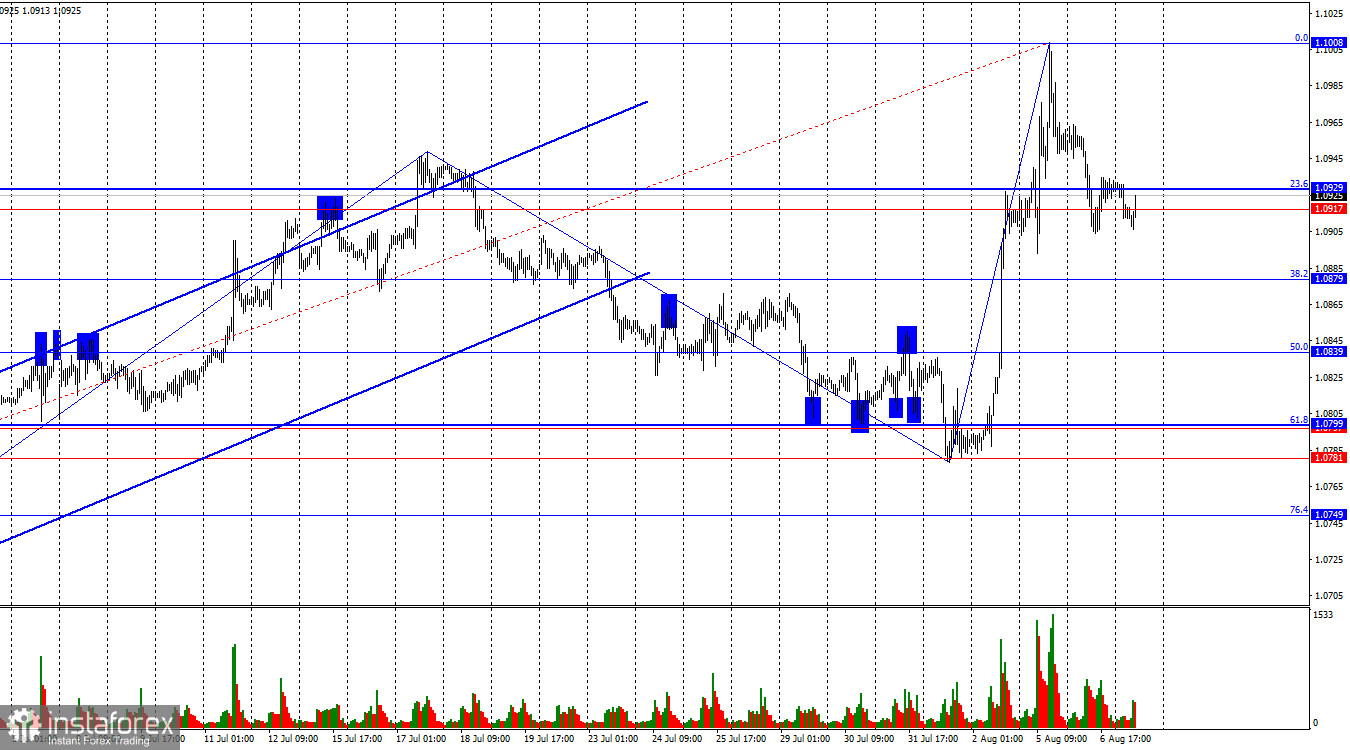
On Tuesday, the EUR/USD pair continued its decline and even managed to settle below the support zone of 1.0917–1.0929. However, the beginning of today's session shows that the bulls are not ready to give up without a fight. If today the pair manages to settle above the zone of 1.0917–1.0929, it may return to the 0.0% retracement level at 1.1008. If the bears keep the pair within or below the zone of 1.0917–1.0929, a decline towards the 38.2% Fibonacci level at 1.0879 will be more likely.
The wave situation has become somewhat more complex, but overall it raises no questions. The last completed downward wave did not break the low of the previous wave, while the new upward wave broke the peak from July 16. Thus, the "bullish" trend still persists. For the "bullish" trend to be canceled, the bears now need to break the low of the last downward wave, which is around the level of 1.0778. Even better, they need to secure below the zone of 1.0781–1.0799, which serves as the strongest support.
The information background on Tuesday was weak both literally and figuratively. The retail sales report in the Eurozone was the only one, and it showed a larger contraction in volumes than traders expected. I doubt that the euro's decline during the day was specifically due to this report, but it could have negatively impacted bullish sentiment. However, it is important to understand what will happen next on a global scale. The market has cooled off a bit after a hot Monday, but it remains unclear whether it has abandoned the idea of the Fed cutting rates by 100 basis points at the next two meetings. Since today's information background will also be weak, the pair's behavior will show us what traders are counting on. New growth will mean that traders are still expecting the most decisive actions from the Fed. In my opinion, this is incorrect, but it is important to understand how the majority of market players think. This morning, Germany released an industrial production report, which showed a 1.4% increase in June (above forecasts). The euro may receive support from this report, but it is unlikely to be long-lasting. No other news is expected today.
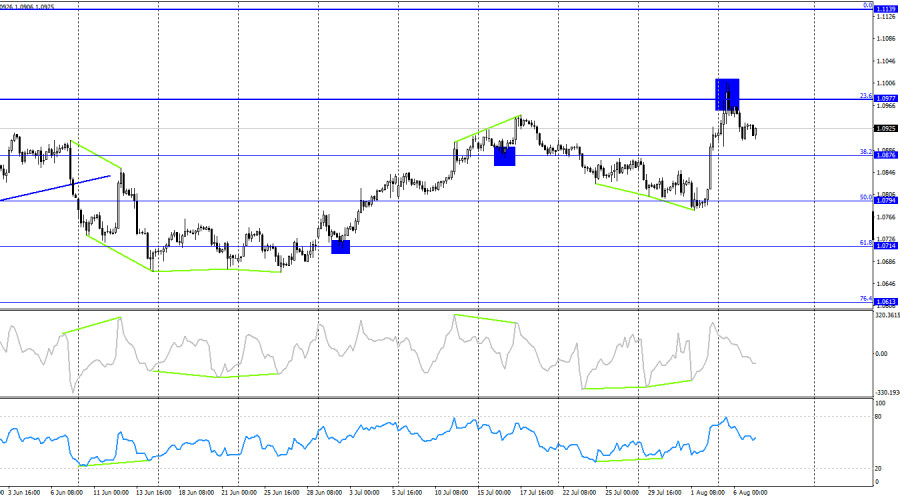
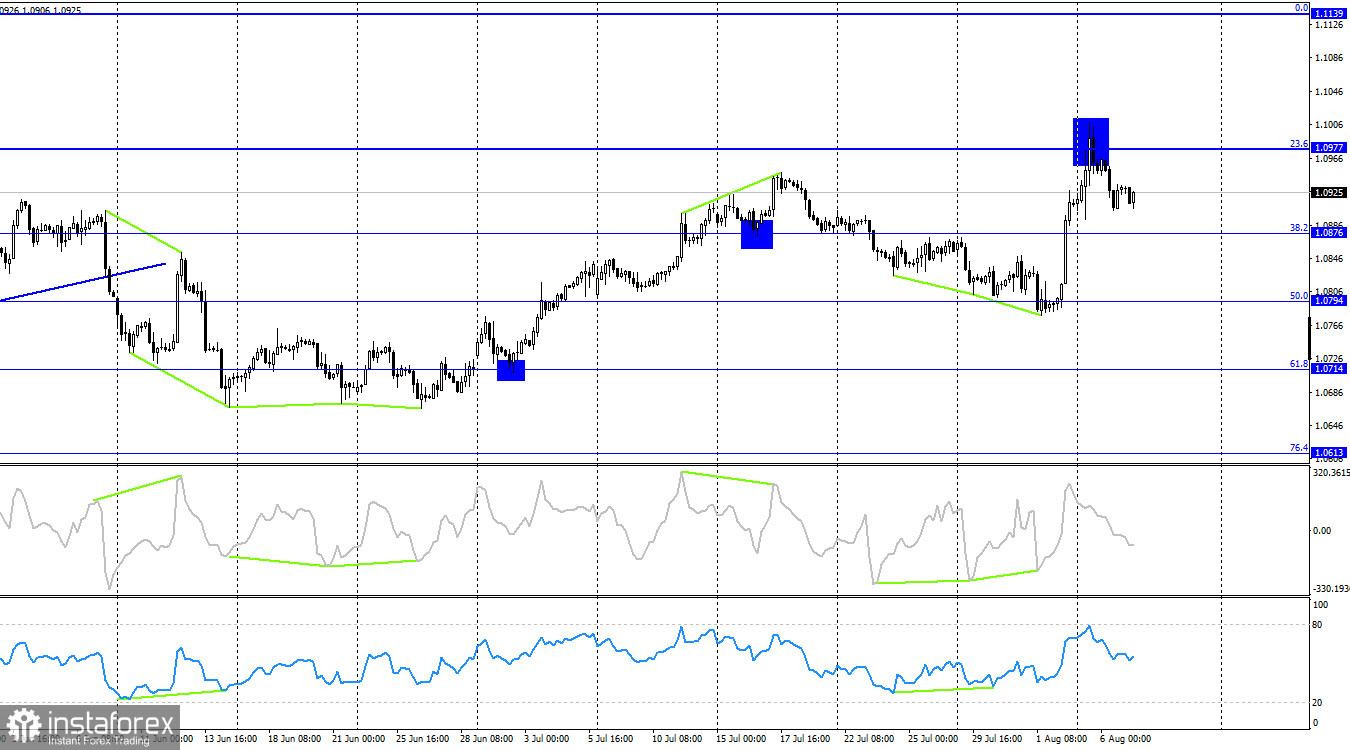
On the 4-hour chart, the pair rebounded from the 23.6% retracement level at 1.0977 and turned in favor of the US dollar. Thus, the decline may continue towards the next Fibonacci level of 38.2% at 1.0876. Securing above the 1.0977 level will increase the likelihood of continued growth towards the next 0.0% retracement level at 1.1139. No emerging divergences are observed in any indicator today.
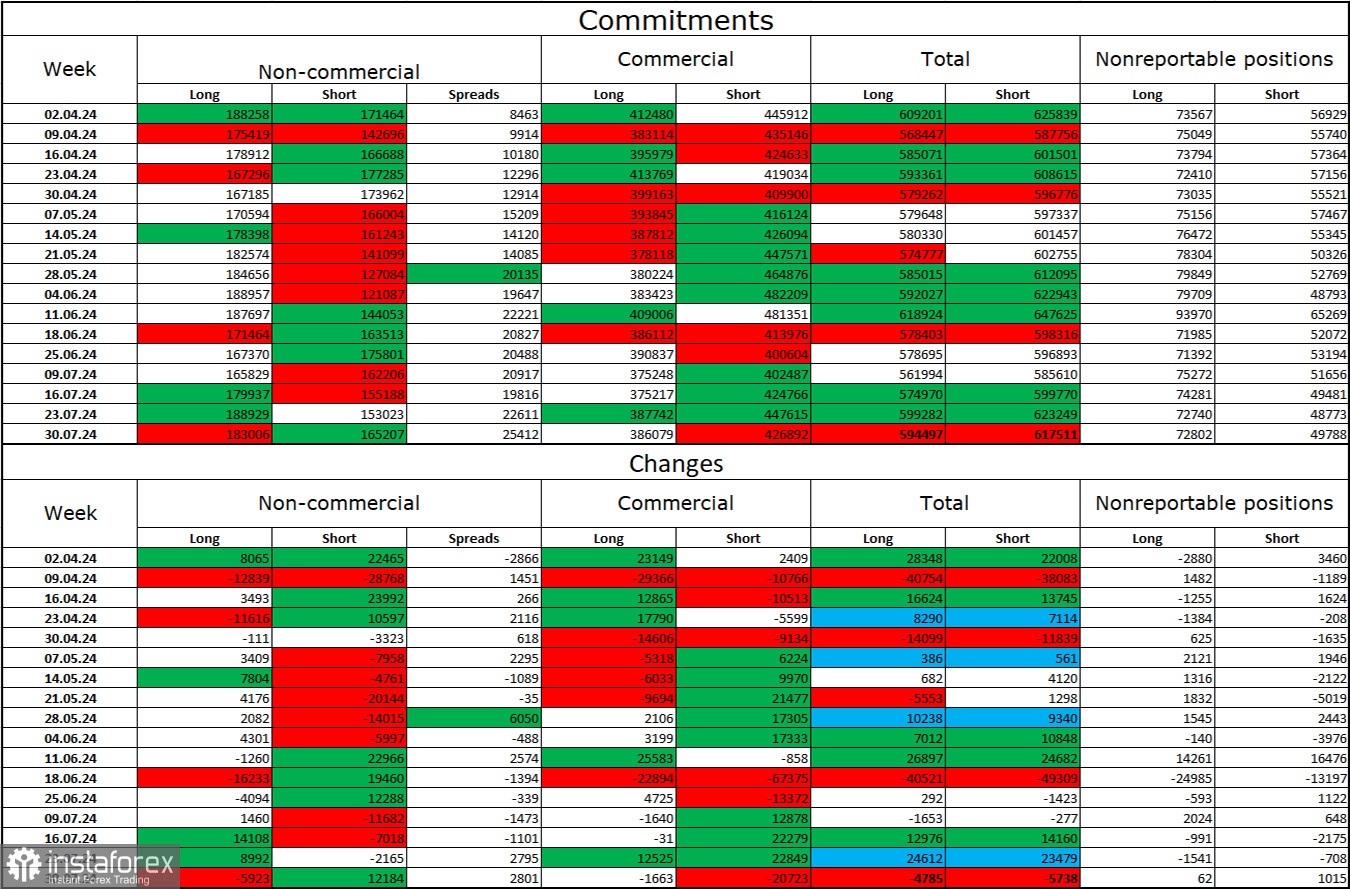
Commitments of Traders (COT) Report:
During the last reporting week, speculators closed 5,923 long positions and opened 12,184 short positions. The sentiment of the "Non-commercial" group turned "bearish" a couple of months ago, but bulls are now dominating again. The total number of long positions held by speculators is now 183 thousand, and the number of short positions is 165 thousand.
I still believe that the situation will continue to favor the bears. I see no long-term reasons to buy the euro, as the ECB has begun to ease monetary policy, which will reduce the yield on bank deposits and government bonds. In the U.S., they will remain at a high level at least until September, making the dollar more attractive to investors. The potential for the euro to decline looks significant. However, do not forget about graphical analysis, which at the moment does not confidently indicate a strong fall for the euro.
Economic Calendar for the US and Eurozone:
Eurozone – Change in industrial production volumes in Germany (06:00 UTC).
On August 7, the economic events calendar contains only one entry, which has already been released. The impact of the information background on trader sentiment for the rest of the day will be absent.
Forecast for EUR/USD and Trader Recommendations:
Sales of the pair are possible today with a target of 1.0879 on the hourly chart if the pair remains below the support zone of 1.0917–1.0929. Purchases will be possible if the pair secures above the support zone of 1.0917–1.0929 on the hourly chart with a target of 1.1008.
Fibonacci levels are built at 1.0668–1.1008 on the hourly chart and at 1.0450–1.1139 on the 4-hour chart.