বৃহস্পতিবার, EUR/USD পেয়ারের দরপতন বজায় রয়েছে এবং এই পেয়ারের মূল্য মুভিং এভারেজ লাইনের নিচে স্থির হয়েছে। কোনো বাধ্যতামূলক কারণ বা ভিত্তি ছাড়াই টানা দ্বিতীয় দিনের মতো ইউরোর দরপতন হয়েছে। মনে করে দেখুন যে সাম্প্রতিক মাসগুলোতে এবং এমনকি গত বছরেও পরিস্থিতি ঠিক এর বিপরীত ছিল। সাধারণত, আপাত কোন কারণ বা ভিত্তি ছাড়াই ইউরোর মূল্য বৃদ্ধি পায়। আমরা ইতোমধ্যে এই সমস্যা নিয়ে আলোচনা করেছি। বছরের শুরু থেকে, আমরা ট্রেডারদের কাছে তুলে ধরেছি যে প্রায়ই অযৌক্তিক কারণে ইউরোর মূল্যের উত্থান দেখা যাচ্ছে। মার্কেটের ট্রেডাররা বছরের শুরু থেকে ফেডারেল রিজার্ভের সুদের হার কমানোর প্রত্যাশা করছে এবং এই প্রত্যাশা ডলারের বিনিময় হারের সাথে যুক্ত হয়েছে। যাইহোক, ঘনিষ্ঠভাবে পর্যবেক্ষণের পর, আমরা এই সিদ্ধান্তে পৌঁছেছি যে মার্কেটের ট্রেডাররা দুই বছর ধরে ফেডের সুদের হার হ্রাসের ভিত্তিতে এই পেয়ারের মূল্য নির্ধারণ করছে। 2022 সালের গ্রীষ্মে, মার্কিন মুদ্রাস্ফীতি কমতে শুরু করে এবং এক মাস পরে, মার্কিন ডলারের দীর্ঘস্থায়ী দরপতন শুরু হয়।
মার্কেটের ট্রেডারা যদি যৌক্তিকতা প্রদর্শন করে, তবে মার্কিন মুদ্রানীতির নমনীয়করণ চক্র শুরু হওয়ার সাথে সাথে ডলারের মূল্যও দীর্ঘ সময়ের জন্য বাড়বে। তদুপরি, ইউরোপীয় কেন্দ্রীয় ব্যাংক, যাদের মুদ্রানীতি প্রাথমিকভাবেই বেশ নমনীয় ছিল, তারাও সুদের হার কমিয়েছে। যেহেতু গত দুই বছরে ইউরোর মূল্য বেড়েছে, তাই আমরা নিশ্চিত যে মার্কেটের ট্রেডাররা এখনও ইসিবির নীতিমালা নমনীয়করণের সিদ্ধান্তে প্রতিক্রিয়া জানায়নি। তাই, আগের মতই, আমরা শুধুমাত্র EUR/USD পেয়ারের দরপতনের আশা করছি, এই পেয়ারের মূল্যের প্যারিটি বা সমতায় নেমে আসার সম্ভাবনা আর অবাস্তব বলে মনে হচ্ছে না।
এই সপ্তাহে একটি নতুন দীর্ঘমেয়াদী প্রবণতা শুরু হয়েছে এটি বলা কিছুটা নির্বোধের মতো কাজ হবে। শুক্রবারে মার্কিন শ্রম বাজার এবং বেকারত্ব সংক্রান্ত প্রতিবেদন প্রকাশিত হবে, এবং যদি এই প্রতিবেদনগুলোর ফলাফল ট্রেডারদের পছন্দসই না হয়, তাহলে আবার মার্কিন ডলারের দরপতন হতে পারে। ট্রেডাররা সম্ভবত আশা করছে যে ফেড 18 সেপ্টেম্বর সুদের হার 0.5% কমিয়ে দেবে এবং তারা সেই পরিস্থিতিতে প্রতিক্রিয়া জানাবে। মনে রাখবেন যে মাসের শুরুতে, ট্রেডারদের মধ্যে অনুরূপ প্রত্যাশা দেখা গিয়ে ছিল এবং অবিলম্বে সুদের হার 50-পয়েন্ট হ্রাসের ভিত্তিতে এই পেয়ারের মূল্য নির্ধারণ করা হয়েছিল। তারপরে, এই প্রত্যাশা ম্লান হয়ে যায়, কিন্তু সেটি ডলারের উপর প্রভাব বিস্তার করেনি। এভাবেই ইউরোর মূল্য বাড়ছে। মার্কেটের ট্রেডাররা ফেডের কাছ থেকে সবচেয়ে বেশি আশা করে থাকে, তাই তাদের প্রত্যাশা পূরণ না হওয়ায় তারা হতাশ হয়ে পড়ে, কিন্তু ডলার আর আসল অবস্থানে ফিরে আসেনি।
সাম্প্রতিক দিনগুলোতে আমরা যা দেখেছি তা একটি নতুন ঊর্ধ্বমুখী মুভমেন্ট শুরুর আগে একটি কারেকশন হতে পারে। আমরা মনে করি যে যদি ট্রেডাররা সত্যিকার অর্থে আরও এক বা দুই মাসের জন্য এই পেয়ার কেনার জন্য প্রস্তুত থাকে, তাহলে অন্তত 100 পিপসের মুভমেন্টের পরিবর্তে অন্তত এই পেয়ারের মূল্যের লক্ষণীয় কারেকশন হওয়া উচিত। এটি লক্ষণীয় যে CCI সূচকটি তিনবার ওভারবট জোনে প্রবেশ করেছে এবং অর্ধ ডজন বিয়ারিশ ডিভারজেন্স দেখিয়েছে। তাহলে কি কারেকশন শুরু হওয়া উচিত নয়? যদিও, এটি একটি কথার কথা। মার্কিন যুক্তরাষ্ট্র আগামী সপ্তাহে প্রকাশিতব্য সামষ্টিক প্রতিবেদনে দুর্বল ফলাফল দেখা গেলে, ডলারের মূল্য আবার অতল গহ্বরে তলিয়ে যেতে পারে। অন্যদিকে, যদি এই প্রতিবেদনগুলোর ফলাফল ইতিবাচক হয় এবং ডলারের মূল্য বেড়ে যায়, তাহলে এটি নির্দেশ করতে পারে যে মার্কেটে এই পেয়ারের মূল্যের অযৌক্তিক ঊর্ধ্বমুখী প্রবণতা শেষ হচ্ছে।
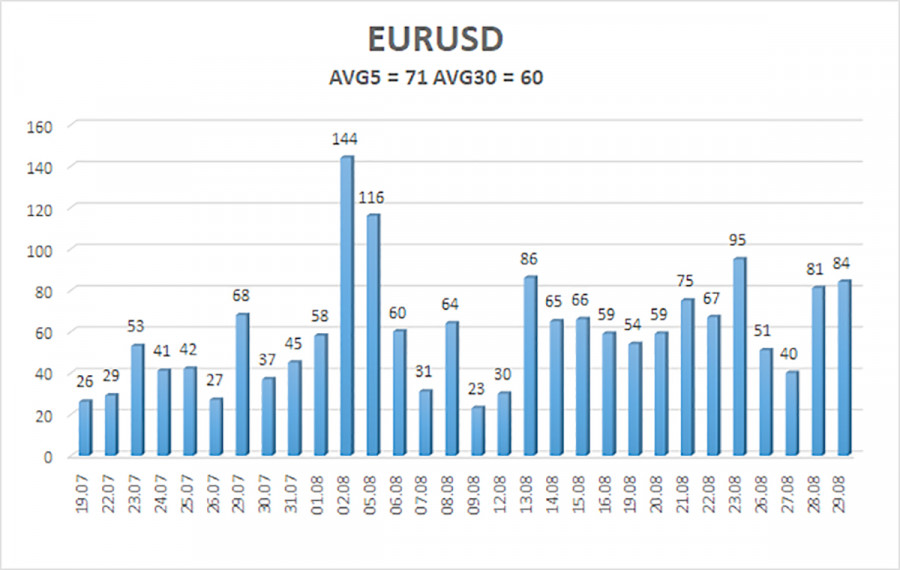
৩০ আগস্ট পর্যন্ত বিগত পাঁচ দিনের ট্রেডিংয়ে EUR/USD-এর মূল্যের গড় অস্থিরতা হল 71 পিপস, যা গড় মান হিসাবে বিবেচিত হয়। আমরা আশা করছি যে শুক্রবার এই পেয়ারের মূল্য 1.1008 এবং 1.1150 এর লেভেলের মধ্যে মুভমেন্ট প্রদর্শন করবে। লিনিয়ার রিগ্রেশনের উপরের চ্যানেলটি উপরের দিকে যাচ্ছে, কিন্তু বিশ্বব্যাপী এই পেয়ারের মূল্যের নিম্নমুখী প্রবণতা বজায় রয়েছে। সিসিআই সূচকটি তিনবার ওভারবট জোনে প্রবেশ করেছে, যা সম্ভাব্যভাবে প্রবণতা বিপরীতমুখী হয়ে নিম্নমুখী প্রবণতার ইঙ্গিত দেয় এবং এই পেয়ারের বর্তমান দর বৃদ্ধি কীভাবে অযৌক্তিক সে ব্যাপারেও সতর্কবার্তা দিচ্ছে।
নিকটতম সাপোর্ট লেভেল:
- S1 – 1.1047
- S2 – 1.0986
- S3 – 1.0925
নিকটতম রেজিস্ট্যান্স লেভেল:
- R1 – 1.1108
- R2 – 1.1169
- R3 – 1.1230
ট্রেডিংয়ের পরামর্শ:
মার্কেটে ক্রমাগত ইউরো ক্রয়ের এবং ডলার বিক্রি করার অনিয়ন্ত্রিত প্রবণতার ফলে EUR/USD পেয়ারের মূল্যের শক্তিশালী এবং নিরবচ্ছিন্ন ঊর্ধ্বমুখী গতিশীলতা অব্যাহত রয়েছে। পূর্ববর্তী পর্যালোচনাগুলোতে, আমরা উল্লেখ করেছিলাম যে আমরা মধ্য মেয়াদে শুধুমাত্র ইউরোর দরপতনের আশা করি, কিন্তু বর্তমানে এই পেয়ারের মূল্য বৃদ্ধি এখন প্রায় উপহাসের মতো মনে হচ্ছে। মার্কেটের ট্রেডাররা এই পেয়ার ক্রয়ের জন্য প্রতিটি সুযোগ ব্যবহার করে চলেছে, কিন্তু প্রযুক্তিগত চিত্র স্থানীয় পর্যায়ে এই পেয়ারের মূল্যের ঊর্ধ্বমুখী প্রবণতা শেষ হওয়ার উচ্চ সম্ভাবনা সম্পর্কে সতর্ক করে। 1.1047 এবং 1.0986 এর লক্ষ্যমাত্রায় শর্ট পজিশন বিবেচনা করা যেতে পারে, কারণ গতকাল এই পেয়ারের মূল্য মুভিং এভারেজের নিচে স্থির হয়েছে।। এই পেয়ারের মূল্যের মোটামুটি উল্লেখযোগ্য নিম্নগামী মুভমেন্ট দেখতে পাওয়ার সম্ভাবনা রয়েছে।
চিত্রের ব্যাখা:
- লিনিয়ার রিগ্রেশন চ্যানেল - বর্তমান প্রবণতা নির্ধারণ করতে সাহায্য করে। যদি উভয়ই একই দিকে পরিচালিত হয়, তাহলে এর অর্থ হল বর্তমানে প্রবণতা শক্তিশালী।
- মুভিং এভারেজ লাইন (সেটিংস 20.0, স্মুথেদ) – স্বল্পমেয়াদী প্রবণতা এবং বর্তমানে কোন দিকে ট্রেডিং করা উচিত তা নির্ধারণ করে।
- মারে লেভেল - মুভমেন্ট এবং কারেকশনের লক্ষ্য মাত্রা।
- অস্থিরতার মাত্রা (লাল লাইন) - সম্ভাব্য প্রাইস চ্যানেল যেখানে এই পেয়ারের মূল্য পরের দিন অবস্থান করবে, যা বর্তমান অস্থিরতা সূচকের উপর ভিত্তি করে নির্ধারণ করা হয়।
- সিসিআই সূচক – এই সূচকের ওভারসোল্ড জোনে (-250-এর নীচে) বা ওভারবট জোনে (+250-এর উপরে) প্রবেশের মানে হল যে চলমান প্রবণতা বিপরীতমুখী হতে যাচ্ছে।


