GBP/USD
Brief analysis:
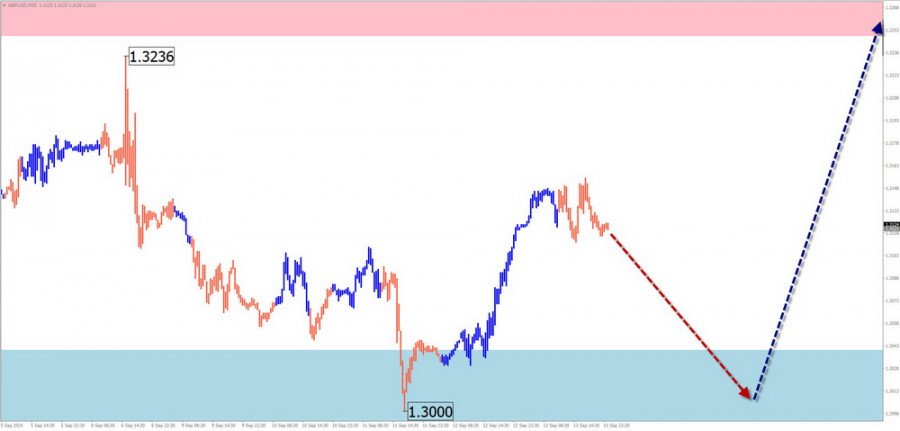
The British pound has been in an uptrend since late last year. The unfinished corrective wave (B) has been pulling the price downward over the past two weeks. Last month's broken resistance has now turned into support.
Weekly forecast:
At the start of the week, the bearish trend is expected to continue down to the support level. Afterward, price movement is likely to shift to a sideways trend, followed by a reversal and an upward movement. The resistance zone indicates the maximum expected range for potential growth.
Potential Reversal Zones:
- Resistance: 1.3250/1.3300
- Support: 1.3040/1.2990
Recommendations:
- Selling: Limited potential due to proximity to support; small positions can be considered during individual sessions.
- Buying: Not recommended until confirmed signals appear near the support zone.
AUD/USD
Brief analysis:
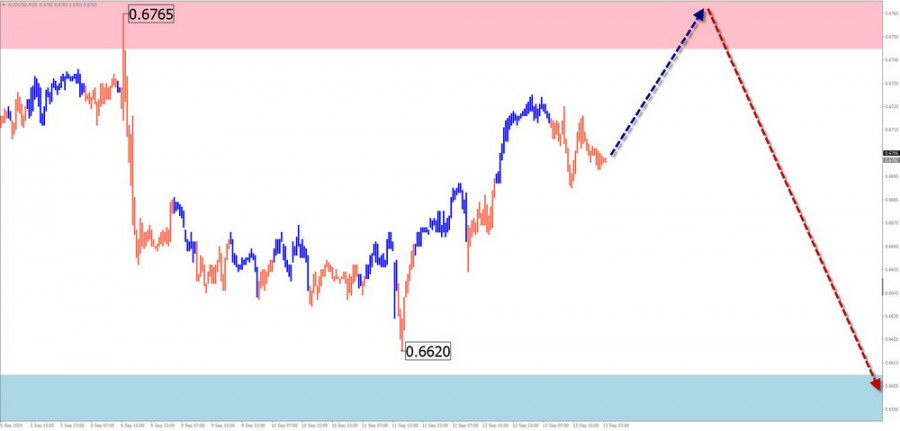
The price movement of the Australian dollar major since early August is driven by an upward wave. The price rebounded from the lower boundary of a strong reversal zone on the daily timeframe. The current wave segment is corrective and started on August 29. Its structure is not yet complete.
Weekly forecast:
At the start of the week, the price is expected to continue moving sideways. The pair is more likely to rise toward the resistance zone. By the weekend, a reversal and resumption of the downward movement may occur.
Potential Reversal Zones:
- Resistance: 0.6760/0.6810
- Support: 0.6610/0.6560
Recommendations:
- Selling: Conditions are not present in the market until reversal signals appear in your trading systems.
- Buying: Small positions can be considered for short-term trades during individual sessions.
USD/CHF
Brief analysis:
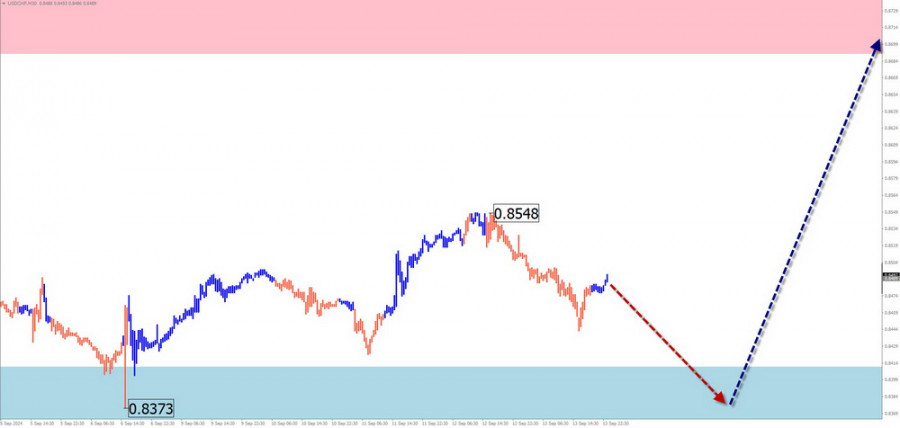
The short-term trend of the Swiss franc has been driven by an upward wave since early August. In recent weeks, the price has been correcting along the upper boundary of a strong potential reversal zone. The correction is not yet complete.
Weekly forecast:
At the start of the week, the downward trend is expected to continue toward the support zone. In the following days, a reversal and upward movement are likely. The resistance zone indicates the upper boundary of the expected weekly range.
Potential Reversal Zones:
- Resistance: 0.8690/0.8740
- Support: 0.8410/0.8360
Recommendations:
- Selling: Limited potential; high risk of losses.
- Buying: Possible after confirmed reversal signals appear near the support zone.
EUR/JPY
Brief analysis:
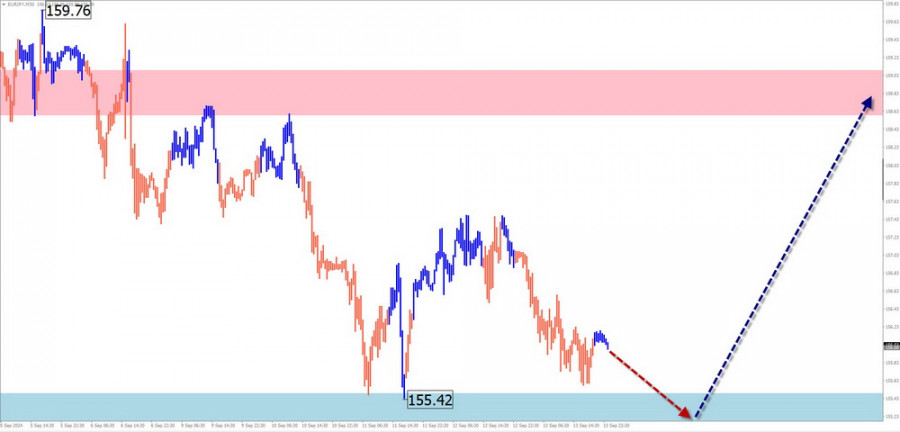
The euro-yen pair has been forming a reversal wave to the "north" since early August. The wave structure shows the formation of the intermediate wave (B). During the past week, prices moved along the support zone on the monthly timeframe.
Weekly forecast:
At the start of the week, prices are expected to continue moving along the support zone. In the second half of the week, there is an increased likelihood of a reversal and a shift to an upward trend. A brief decline below the lower boundary of the zone is possible.
Potential Reversal Zones:
- Resistance: 158.60/159.10
- Support: 155.50/155.00
Recommendations:
- Selling: No potential; high risk.
- Buying: May become the primary trading direction after confirmed signals appear near the support zone in your trading systems.
US Dollar Index
Brief analysis:
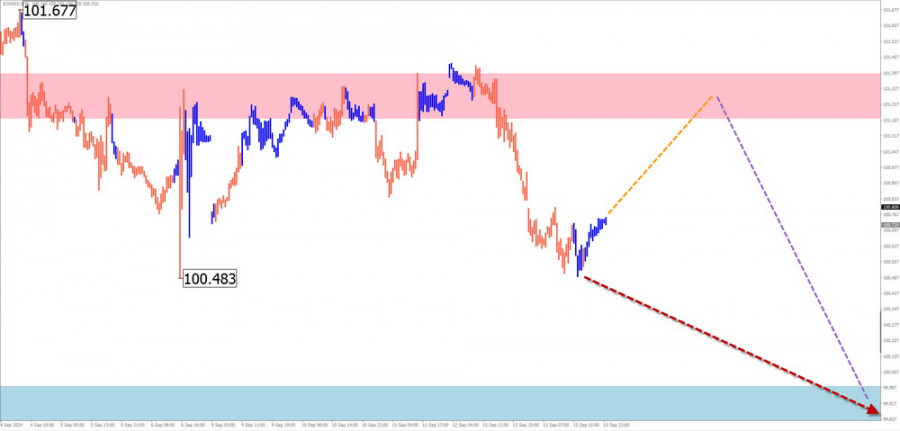
The short-term trend of the US dollar index has been downward since late July. The current wave on the weekly timeframe is forming a correction. The wave structure shows an intermediate pullback along a previously broken support level, which has now become resistance. The final part (C) is yet to follow.
Weekly forecast:
At the start of the week, the index is likely to continue moving sideways. A rise toward resistance levels is possible. In the second half of the week, activity may increase, and the downward trend could resume. The support zone is located near the upper boundary of the target zone for the current wave.
Potential Reversal Zones:
- Resistance: 101.20/101.40
- Support: 100.00/99.80
Recommendations:
- Dollar growth trades: Premature. Strengthening of national currencies and weakening of the US dollar should be prioritized for the upcoming week.
Bitcoin
Brief analysis:
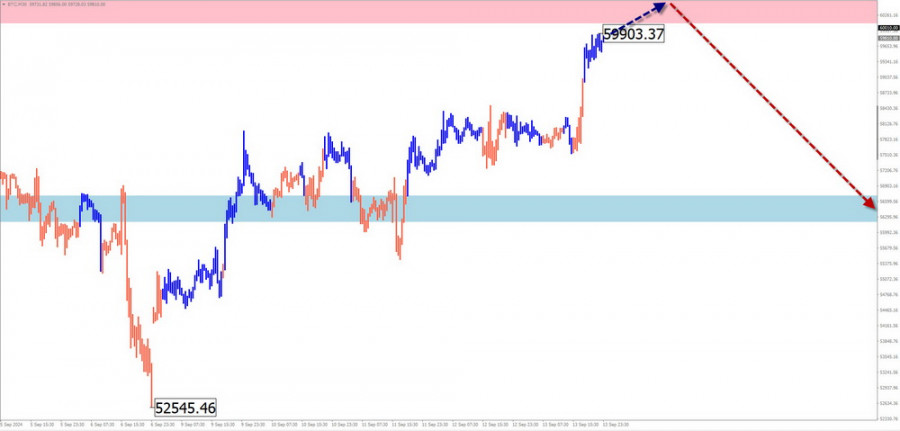
After a period of weakening, Bitcoin has entered a growth phase. The bullish wave over the past month and a half has mostly traded sideways. The wave structure indicates conditions for a sharp upward movement. The price is approaching intermediate resistance. Before further growth, a brief pullback is expected.
Weekly forecast:
At the start of the week, Bitcoin is expected to continue its sideways movement. A rise toward the resistance zone is possible. Increased volatility and a brief price drop may occur by the weekend. A break below the support zone within the weekly period is unlikely.
Potential Reversal Zones:
- Resistance: 60100.0/60600.0
- Support: 56700.0/56200.0
Recommendations:
- Selling: High risk in the current market; limited potential, high chance of losses.
- Buying: Possible after confirmed reversal signals appear in your trading systems.
Gold
Brief analysis:
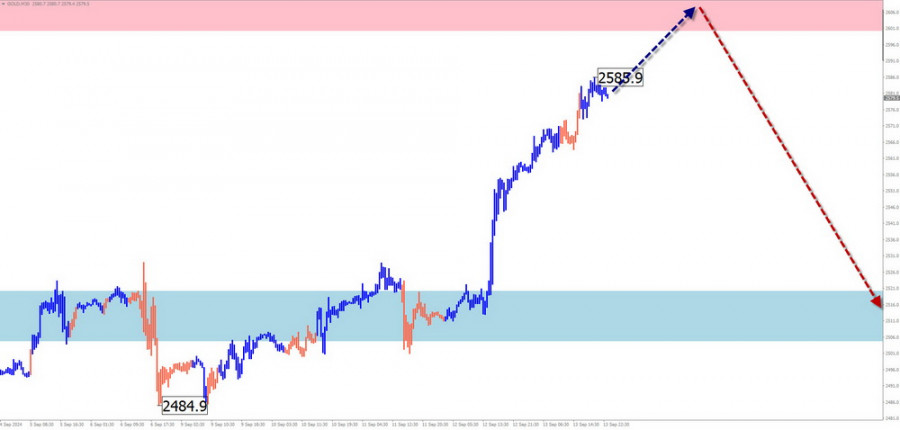
Gold prices continue their upward movement, which began two years ago. The main wave structure is nearing completion. Prices have reached the boundaries of a potential reversal zone on the daily timeframe. There are no signs of an imminent reversal.
Weekly forecast:
In the coming days, the price is expected to continue rising toward the resistance zone. Afterward, the price is likely to enter a sideways movement, creating conditions for a reversal. A brief breakout above the upper boundary of the zone is possible.
Potential Reversal Zones:
- Resistance: 2600.0/2620.0
- Support: 2520.0/2500.0
Recommendations:
- Buying: Limited potential; could lead to losses.
- Selling: Could become promising after confirmed reversal signals appear near the resistance zone in your trading systems.
Explanation: In simplified wave analysis (SWA), all waves consist of three parts (A-B-C). The last incomplete wave is analyzed at each timeframe. Dashed lines represent expected movements.
Note: The wave algorithm does not account for the duration of movements over time!


