empty
 
 
11.11.2021 05:57 PM
Bitcoin: Is bearish engulfing as scary as it is painted?

The history of bitcoin volatility has taught us that it is at least uninformative to draw conclusions on a non-closed daily candle. So on Wednesday, despite the optimism and the update of historical values, the last four hours not only neutralized all the daily gains but also led to the formation of a bearish engulfing.

Should we give up short-term recovery prospects now, and what to expect from Bitcoin?

$706 million liquidated on the market

Wednesday's collapse resulted in the most vulnerable positions of bitcoin derivatives traders - leveraged trades - suffered.

Over the past 24 hours, over $706 million in short and long positions have been liquidated across all trading pairs, according to analytics provided by independent service Coinglass (formerly Bybt).

Here the majority of liquidations are long positions - buyers have been thrown out of the market. 77% of all liquidated traders were bullish. And on Bitfinex, the share of longs is 90%.

In just the last 24 hours, more than 174,000 traders have lost their positions. The largest liquidation of $10,000,000 happened on BitMEX.

What caused Bitcoin to crash?

At first glance, there are no significant fundamental catalysts for volatility. The data on inflation in the USA, which came out in the afternoon, supported Bitcoin. But later, according to some experts, the cryptocurrency market fell following the stock market.

Another alleged reason is the slipped news of the bankruptcy of the Chinese developer Evergrande, which provoked a risk aversion.

However, in my opinion, there is no point in looking for fundamental reasons now. Something global, like a Chinese ban or ETF approval, did not happen. This is most likely just a local correction, possibly associated with partial profit-taking. Against this background, it is worth focusing mainly on technology.

Correction, consolidation, breakout

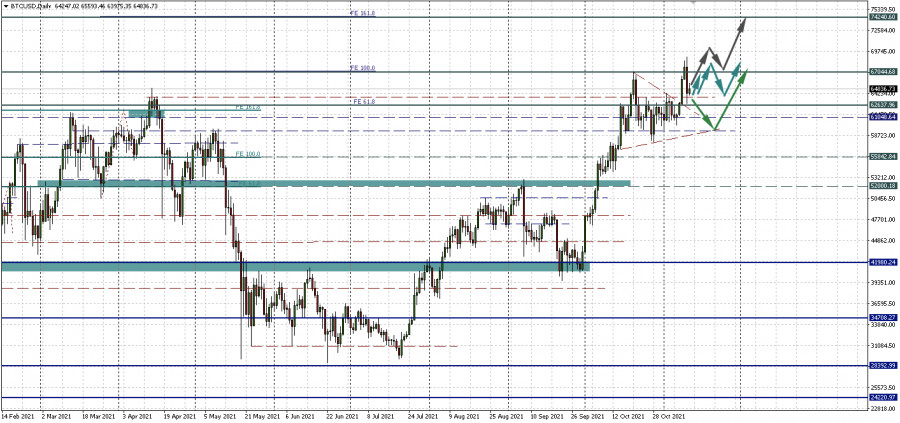
The bearish engulfing candlestick pattern looks alarming in this situation. But, as we have already seen, in October, after reaching the previous historic highs, its signal may indicate a temporary reversal.

Now the level of 63,722.20 is planned as a support - the red dotted line, which previously worked as the upper border of the consolidation range. If it holds, a new sideways trend may start, where the resistance will be at the level of $67,000 per coin.

The scenario of a deeper correction in the breakout of 63,722.20 could lower the main cryptocurrency to $60,000 per bitcoin.

And if we assume the most optimistic scenario with the completion of the correction now, then we can soon see an update of the historical maximum.

This image is no longer relevant

Ekaterina Kiseleva,
Analytical expert of InstaForex
© 2007-2024
Earn on cryptocurrency rate changes with InstaForex
Download MetaTrader 4 and open your first trade
  • Grand Choice
    Contest by
    InstaForex
    InstaForex always strives to help you
    fulfill your biggest dreams.
    JOIN CONTEST
  • Chancy Deposit
    Deposit your account with $3,000 and get $5000 more!
    In November we raffle $5000 within the Chancy Deposit campaign!
    Get a chance to win by depositing $3,000 to a trading account. Having fulfilled this condition, you become a campaign participant.
    JOIN CONTEST
  • Trade Wise, Win Device
    Top up your account with at least $500, sign up for the contest, and get a chance to win mobile devices.
    JOIN CONTEST
  • 100% Bonus
    Your unique opportunity to get a 100% bonus on your deposit
    GET BONUS
  • 55% Bonus
    Apply for a 55% bonus on your every deposit
    GET BONUS
  • 30% Bonus
    Receive a 30% bonus every time you top up your account
    GET BONUS

Recommended Stories

Can't speak right now?
Ask your question in the chat.
Widget callback