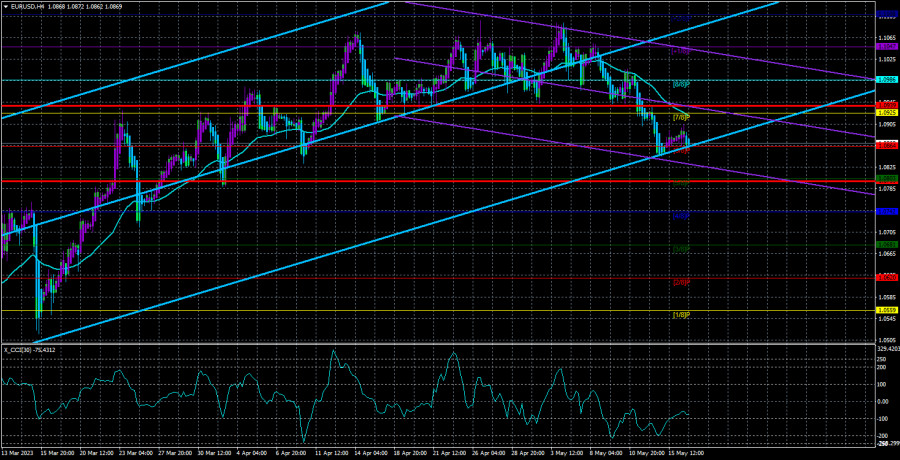
The EUR/USD currency pair traded on Tuesday with the same dynamics and volatility as Monday's. That is, it was minimal. Throughout the day, the pair could not even reach the moving average line, although it was moving towards it. Therefore, formally, the correction continues, but the technical picture has not changed at all in the first two days of the week. The European currency is still aimed at correction, which is now welcomed by almost all technical and fundamental factors. There is no positive news from the European Union that could make traders start buying the pair again. The European currency is heavily overbought, and its growth potential has significantly decreased after the ECB began to hint unequivocally at the possible end of the monetary policy tightening cycle soon. No matter how you look at it, the euro should continue to fall.
We want to remind you once again that the market is a place where there are only a few hundred percent forecasts. Even if factors point to a decline, it does not mean that growth is completely excluded. Therefore, even in the current situation, you should recognize short positions and remember about stop-loss. The European currency can easily correct "for the sake of it" and then resume inertial growth in the Bitcoin style. Therefore, you should never lose your head.
However, if you still look closely at the "fundamentals" and "techniques," the following remains. The ECB will raise the key rate 1-2 more times. It doesn't matter whether this is true or not; the main thing is that the market is now pricing in this scenario. The European currency has been growing for nine months, and there are no factors for further growth. Since the price cannot simply stand still, it must consolidate. That is, move downward.
The ECB understands that the war against inflation will be long.
The Federal Reserve is best at fighting inflation. The Fed's rate has already risen to 5.25%, and inflation has not even halved yet, although it has been falling for 8 or 9 months. This case perfectly shows that inflation can grow quickly and as much as it wants but will decrease slowly and with difficulty. The United States has already experienced three major bank failures due to aggressive monetary policy. These are the consequences of raising the rate and fighting inflation. What about the EU? Peak inflation was higher than in the US. The ECB rate began to rise a few months later, rose slower, is currently lower than the Fed's rate, and will definitely rise weaker than the Fed's rate in the future. Everything indicates that returning inflation to the target level will take longer than in the US. As a result of April, for example, inflation in the EU may increase again, albeit quite insignificantly.
In other news, the almost zero GDP in the first quarter is worth noting, and it has been this way for two quarters in a row. That is, the European economy (again, unlike the American one) is growing slowly. The three most important macroeconomic indicators (inflation, GDP, and rates) do not favor the euro currency. Moreover, the European Commission has raised inflation forecasts for the coming years. It is now expected that inflation in 2023 will be 5.8% and, in the following year - 2.8%. As we predicted, the return of inflation to 2% can take about three years. And all this time, the key rate must be at a "restrictive" level so that inflation continues to slow down. And all this time, the European economy should not require new monetary stimulation. And this means there should be no new financial, economic crises, major bank crashes, or other economic "cataclysms" over the next three years. What can cause the euro to show growth? From a technical point of view, we are waiting for the Heiken Ashi indicator to turn down for new short positions.

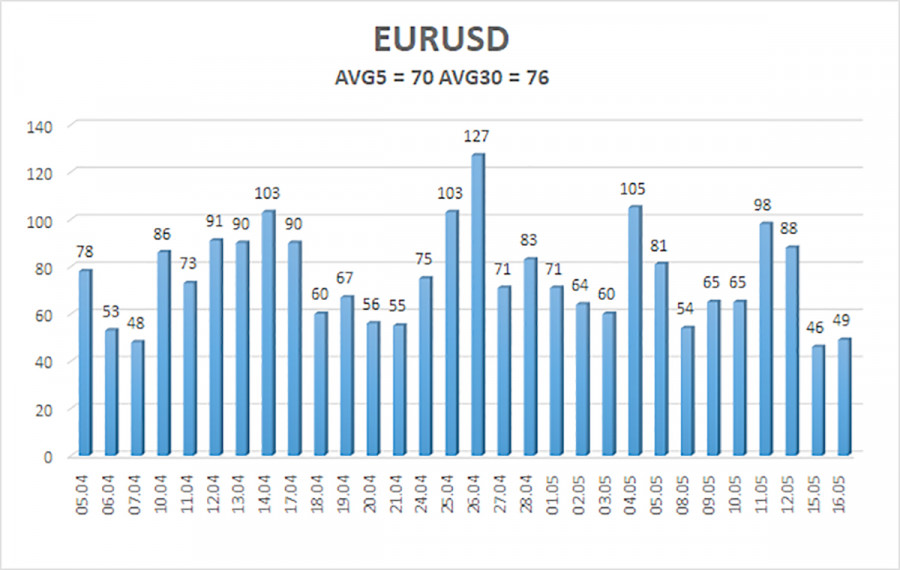
The average volatility of the euro/dollar currency pair for the last five trading days as of May 17 is 70 points and is characterized as "average." Thus, we expect the pair to move between levels 1.0799 and 1.0939 on Wednesday. The reversal of the Heiken Ashi indicator back upward will indicate a new round of corrective movement.
Nearest support levels:
S1 – 1.0864
S2 – 1.0803
S3 – 1.0742
Nearest resistance levels:
R1 – 1.0925
R2 – 1.0986
R3 – 1.1047
Trading recommendations:
The EUR/USD pair has left the sideways channel and can now continue to form a new downward trend. It would help if you remained in short positions until the Heiken Ashi indicator turns up with targets 1.0803 and 1.0799. Long positions will again become relevant as the price consolidates above the moving average with a target of 1.0986.
Explanations for the illustrations:
Linear regression channels - help to determine the current trend. If both are directed in one direction, the trend is strong now.
Moving average line (settings 20.0, smoothed) - determines the short-term trend and the direction in which you should trade now.
Murray levels - target levels for movements and corrections.
Volatility levels (red lines) - the likely price channel the pair will spend the next day, based on current volatility indicators.
CCI indicator - its entry into the oversold area (below -250) or the overbought area (above +250) means that a trend reversal in the opposite direction is approaching.


