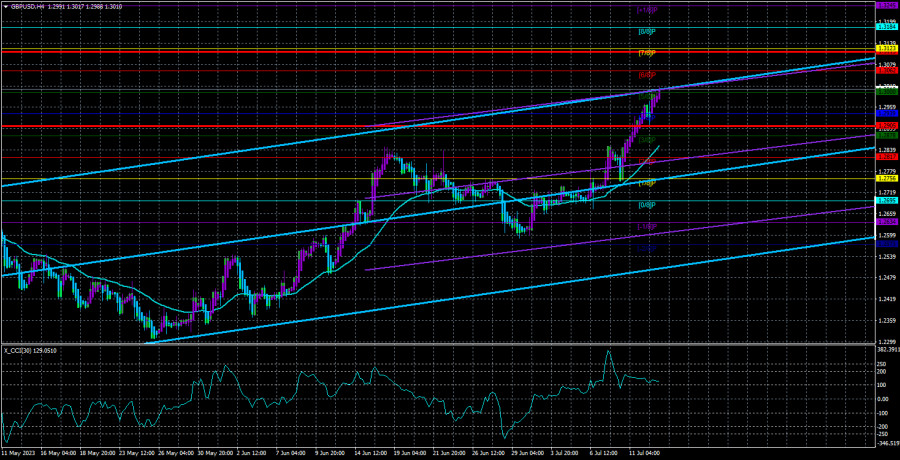
GBP/USD showed growth on Wednesday. This rise continues even now, although a new day has begun and no macroeconomic statistics have been published yet. But this does not matter for the market at the moment. The main thing is to continue selling the dollar.
We have been talking about a bearish-without-any-reason greenback for several months now. In the 24-hour time frame, it is clearly seen that the pair has been through small corrections over the past 10 months of an uptrend. The pound has already risen by 2,600 pips and shows no signs of stopping. Yesterday, traders had an actual reason to buy the pair, and that is all that the market needs at the moment - to establish a strong trend. Notably, the pound continued to rise despite the release of disappointing statistics in the UK on Tuesday. The market started pricing in the US inflation report as early as Monday. It remains to be seen how the market reacts to GDP and industrial production data in the UK due today.
The situation is still the same. The sterling is rising, and the CCI indicator signals overbought conditions. Moreover, there has been almost no correction. The fundamental backdrop is dubious, and the macroeconomic situation does not unequivocally support the pound. The uptrend is almost uninterrupted. It is impossible to predict how long the pair will remain in this mode. There is a good trend, and one can profit from it. However, in that case, it is wiser to simply ignore fundamentals and macro data.
Bailey warns of tighter labor market
Andrew Bailey is perhaps the most unpredictable head of a central bank. His speeches are often unplanned and appear on the calendar just a few hours before the actual event. During his speeches, he rarely makes loud statements, so the market simply does not know what to expect from the British regulator. Therefore, it buys the pound just in case. We have already mentioned before that many experts are no longer analyzing but rather explaining the uptrend of the pair. For example, analysts from Credit Suisse stated yesterday that it would be unwise to sell the pound due to negative real rates or because the country's economy may enter a long-lasting recession. After all, everyone invests in the economy and currency of the country that is going through difficult times and has vague prospects.
If we are talking about the United Kingdom, we should understand that its economy is still very strong. Much stronger than practically any country except the United States or China. However, the pound is rising rapidly, which indicates strong supporting factors. But the arguments of many experts now seem like an attempt to explain the unexplainable.
Speaking of Andrew Bailey's speech, he stated that there are signs of cooling in the labor market at the moment, and wages are too high to expect a quick return of inflation to the target level. Is it another hint at a tightening continuation? The market understands perfectly well that the interest rate in the UK will be raised further. Nobody cares about what will happen to the economy afterward at the moment. Clearly, 5% is a high rate of inflation. The consequences for a more resilient economy, like the United States, would be not so serious. But the British economy has been in crisis since 2016.
For now, everything looks as if the Bank of England has bet on inflation and will deal with the economic problems later when they arise. Well, that is a reason to buy the pound, but then a significant decline in its value will be inevitable.
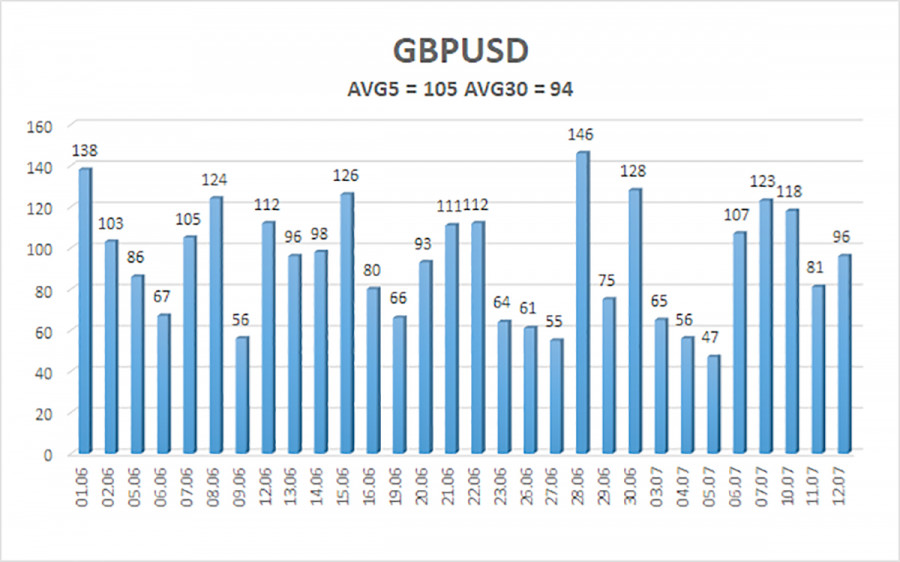
The 5-day average volatility of GBP/USD totals 105 pips and is considered moderate. The price will likely be in the range between 1.2905 and 1.3115 on Thursday. Heikin Ashi's reversal to the downside will indicate a bearish correction.
Support:
S1 – 1.2939
S2 – 1.2878
S3 – 1.2817
Resistance:
R1 – 1.3000
R2 – 1.3062
R3 – 1.3123
Outlook:
GBP/USD continues its bull run on the 4-hour chart. Targets stand at 1.3062 and 1.3123, which should be held until Heikin-Ashi's reversal to the downside. Once the price consolidates below the Moving Average, we can consider selling with targets at 1.2817 and 1.2756.
Indicators on charts:
Linear Regression Channels help identify the current trend. If both channels move in the same direction, a trend is strong.
Moving Average (20-day, smoothed) defines the short-term and current trends.
Murray levels are target levels for trends and corrections.
Volatility levels (red lines) reflect a possible price channel the pair is likely to trade in within the day based on the current volatility indicators.
CCI indicator. When the indicator is in the oversold zone (below 250) or in the overbought area (above 250), it means that a trend reversal is likely to occur soon.


