empty
 
 
09.08.2023 10:40 AM
EUR/USD and GBP/USD: Trading plan for beginner traders on August 9, 2023

Details of the economic calendar on August 8

Only the speeches of a few representatives of the U.S. Federal Reserve System attracted special interest on Tuesday since important economic indicators were not published.

Philadelphia Fed President Patrick Harker stated that if no alarming news appeared by mid-September, they could reach a point where it would be possible to show patience and keep interest rates at the current level.

Analysis of trading charts from August 8

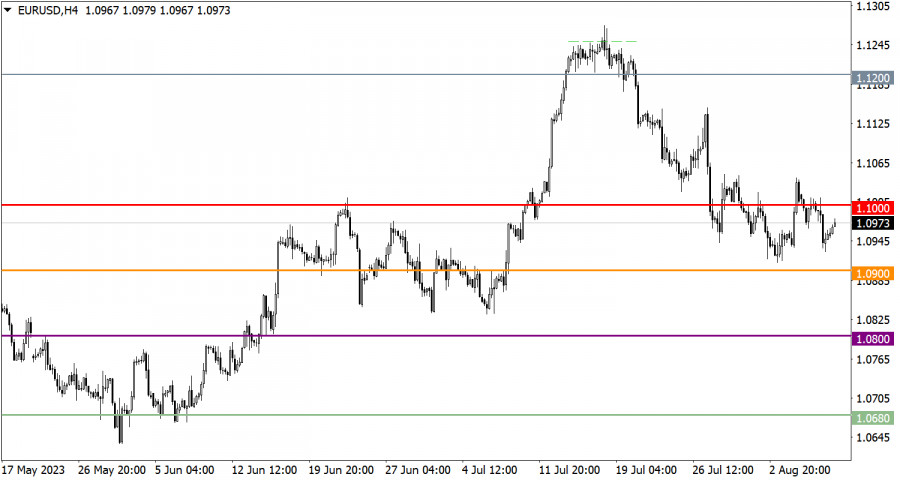
The EUR/USD exchange rate almost reached a local low within the current correction cycle during its downward movement. However, a reduction in the volume of short positions is observed near this point, leading to a slight pullback.

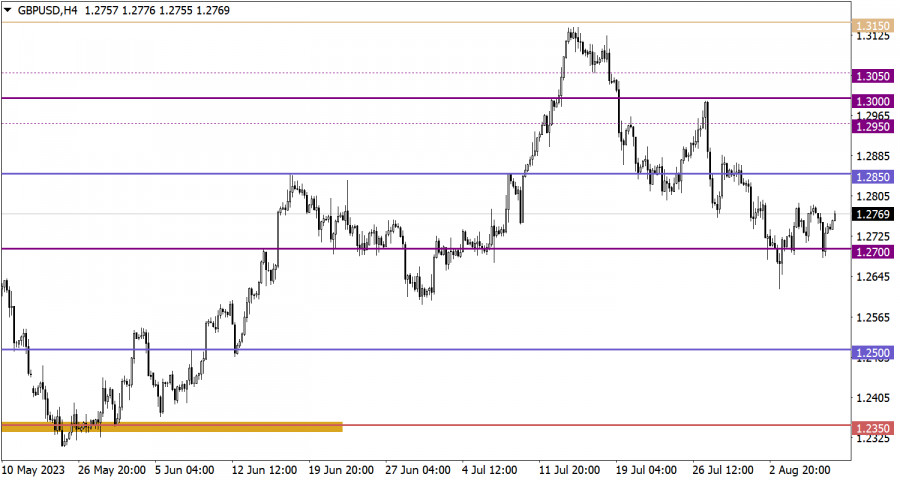
GBP/USD reached the 1.2700 level, where a reduction in the volume of dollar positions is observed. As a result, a price rebound occurred, which almost completely compensated for the recent decline.

This image is no longer relevant

Economic calendar for August 9

The third trading day is already underway without significant statistical data. Due to this, traders continue to actively analyze the incoming information and news flow, focusing on statements from central bank representatives.

EUR/USD trading plan for August 9

In the current situation, a technical signal for continuing the correction cycle will become evident if the price remains below the 1.0900 mark. If this condition is met, a subsequent increase in the volume of short positions is possible. Meanwhile, an upward scenario will become relevant if the quote holds above the 1.1050 level. In this case, a gradual recovery of the euro's exchange rate can be expected, which may eventually lead to the end of the current correction.

This image is no longer relevant

GBP/USD trading plan for August 9

The risk of ending the correction cycle remains as long as the price does not consistently stay below the 1.2700 level in the daily period. However, a full-fledged signal for the possible growth in the volume of long positions in pound sterling may arise if the price remains above the 1.2800 mark.

This image is no longer relevant

What's on the charts

The candlestick chart type is white and black graphic rectangles with lines above and below. With a detailed analysis of each individual candle, you can see its characteristics relative to a particular time frame: opening price, closing price, intraday high and low.

Horizontal levels are price coordinates, relative to which a price may stop or reverse its trajectory. In the market, these levels are called support and resistance.

Circles and rectangles are highlighted examples where the price reversed in history. This color highlighting indicates horizontal lines that may put pressure on the asset's price in the future.

The up/down arrows are landmarks of the possible price direction in the future.

Gven Podolsky,
Analytical expert of InstaForex
© 2007-2024
Earn on cryptocurrency rate changes with InstaForex
Download MetaTrader 4 and open your first trade
  • Grand Choice
    Contest by
    InstaForex
    InstaForex always strives to help you
    fulfill your biggest dreams.
    JOIN CONTEST
  • Chancy Deposit
    Deposit your account with $3,000 and get $6000 more!
    In December we raffle $6000 within the Chancy Deposit campaign!
    Get a chance to win by depositing $3,000 to a trading account. Having fulfilled this condition, you become a campaign participant.
    JOIN CONTEST
  • Trade Wise, Win Device
    Top up your account with at least $500, sign up for the contest, and get a chance to win mobile devices.
    JOIN CONTEST
  • 100% Bonus
    Your unique opportunity to get a 100% bonus on your deposit
    GET BONUS
  • 55% Bonus
    Apply for a 55% bonus on your every deposit
    GET BONUS
  • 30% Bonus
    Receive a 30% bonus every time you top up your account
    GET BONUS

Recommended Stories

Can't speak right now?
Ask your question in the chat.
Widget callback