Analysis of EUR/USD 5M
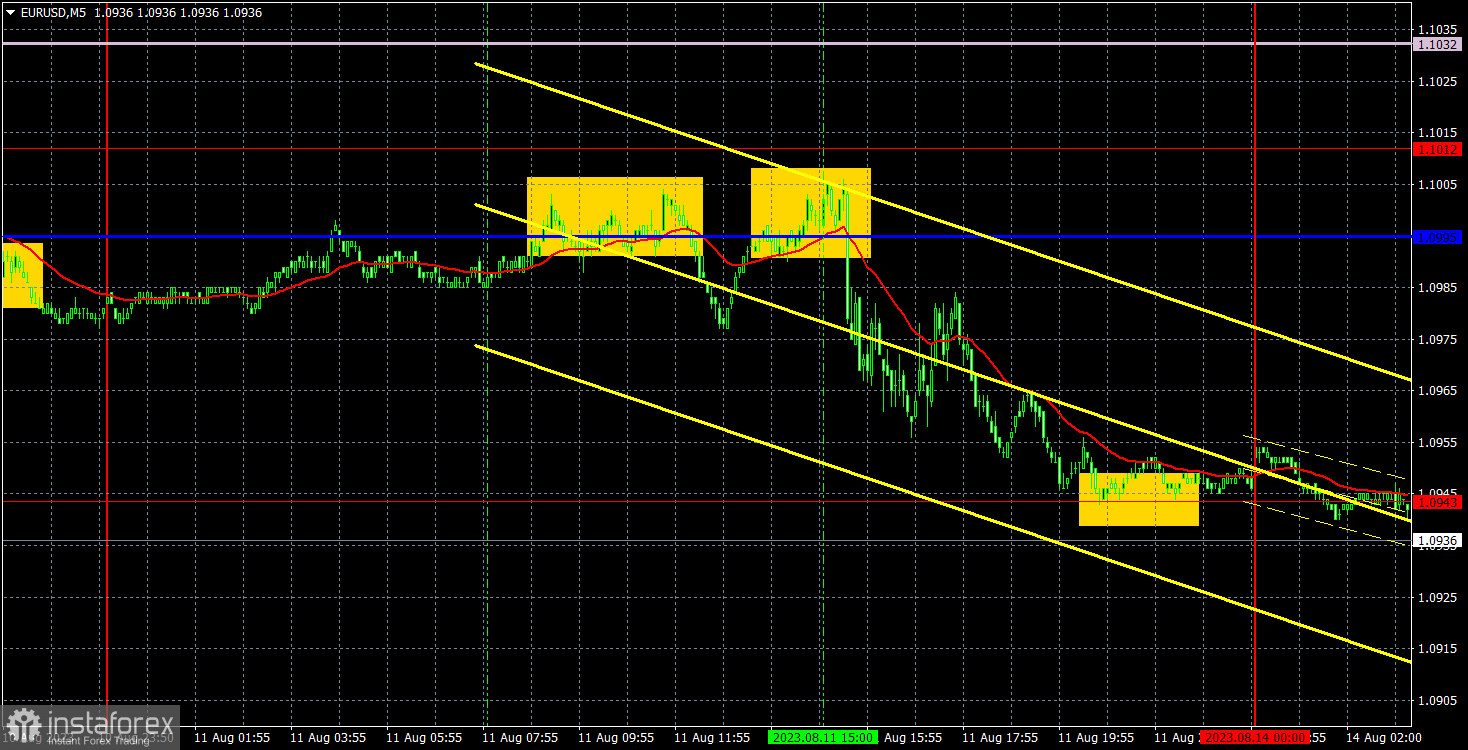
On Friday, the EUR/USD pair traded lower within the sideways channel, which is clearly visible on the hourly chart. Basically, the pair spent the past trading week in a sideways channel, so we could have expected the decline on Friday even without a macroeconomic background. But the macro data also supported the US dollar, so it was logical for the greenback to rise. The US released its consumer sentiment report from the University of Michigan. Traders could ignore it since the actual value came in line with forecasts. The second report was the not-so-significant producer price index, which, like the main inflation, increased at the end of July. Naturally, the chances of a Federal Reserve rate hike grew even more, and along with it, the US dollar.
Friday's trading signals were quite good. During the European session, the pair rebounded twice from the area of 1.0995-1.1012, forming sell signals. In the first instance, the pair fell by about 10 points, and traders couldn't set a stop loss at break-even. Therefore, by the time the second signal was formed, traders should have stayed in a short position. The second sell signal was more successful, and by the end of the day, the price dropped to the level of 1.0943, where it was appropriate to lock in profits. Traders could earn about 35 points from this deal since volatility was not high.
COT report:
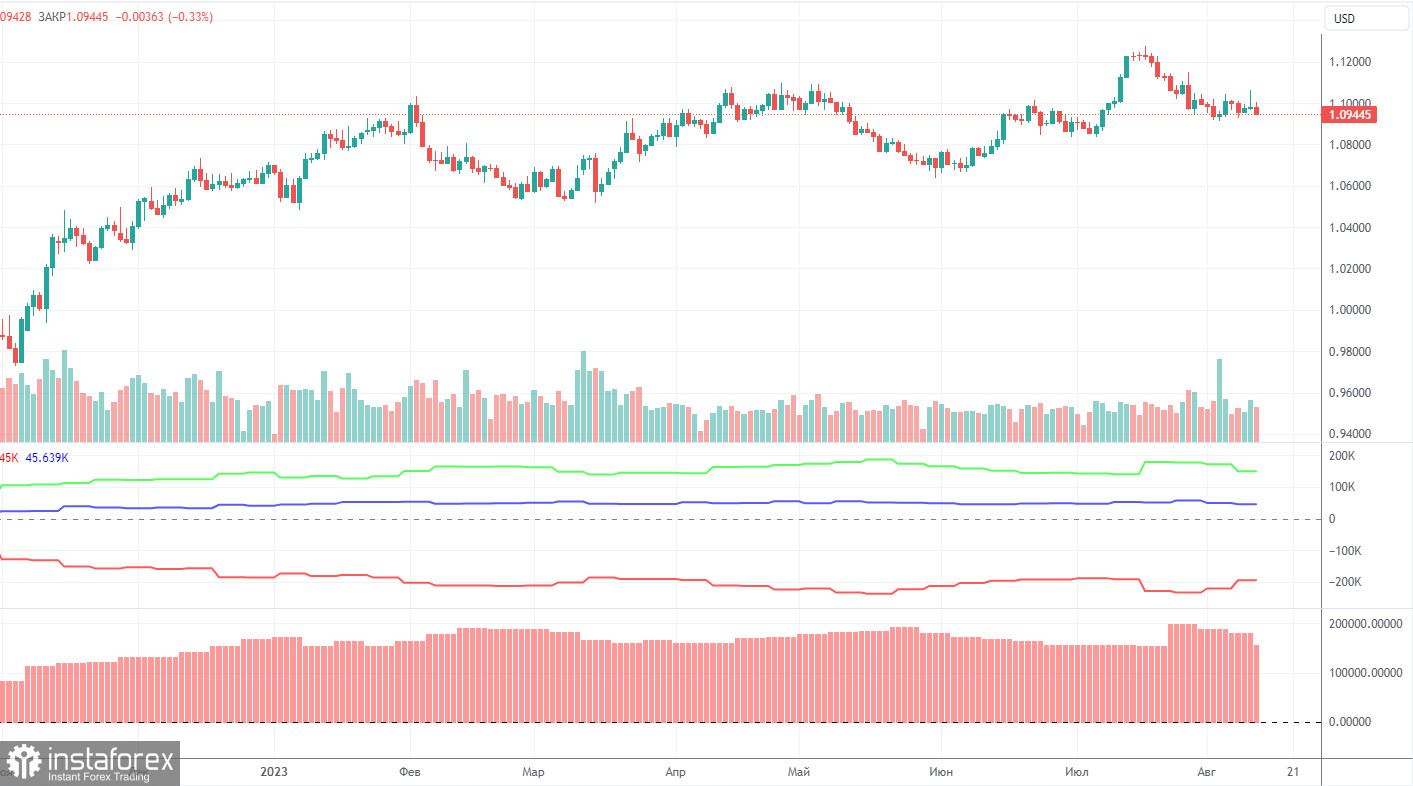
On Friday, a new COT report for August 8 was released. In the last 11 months, COT reports fully corresponded to what is happening in the market. The chart above clearly shows that the net position of major traders (the second indicator) began to grow in September 2022 and at about the same time the euro started climbing too. In the last 6-7 months, the net position has not risen but the euro remains at very high levels. At the moment, the net position of non-commercial traders is bullish and remains strong. The euro keeps climbing against the US dollar.
I have already mentioned the fact that a fairly high value of the net position signals the end of an uptrend. This is also confirmed by the first indicator where the red and green lines are very far from each other. Usually, it precedes the end of the trend. During the last reporting week, the number of long positions of the non-commercial group of traders fell by 12,000 and the number of short ones increased by 10,200. The net position decreased by another 22,200 contracts. The number of long positions is higher than the number of short ones of non-commercial traders by 150,000. This is a very large gap as the difference is almost threefold. Even without COT reports, it is obvious that the euro should decline but speculators are still in no hurry to sell.
Analysis of EUR/USD 1H
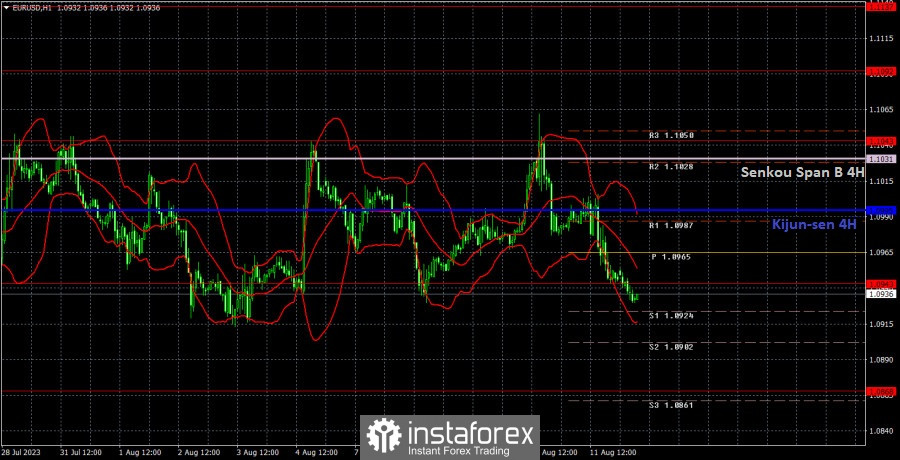
On the 1H chart, the downtrend persists while staying within a sideways channel. We believe that the euro should fall in the medium-term period. Currently, the price is below all the lines of the Ichimoku indicator. The flat has not ended yet, so the pair could rise at the beginning of the week.
On August 14, traders should pay attention to the following key levels: 1.0762, 1.0806, 1.0868, 1.0943, 1.1043, 1.1092, 1.1137, 1.1185, 1.1274, as well as the Senkou Span B line (1.1031) and the Kijun-sen line (1.0995). The lines of the Ichimoku indicator can move during the day, which should be taken into account when determining trading signals. There are support and resistance levels that can be used to lock in profits. Traders look for signals at rebounds and breakouts. It is recommended to set the Stop Loss orders at the breakeven level when the price moves in the right direction by 15 pips. This will protect against possible losses if the signal turns out to be false.
Today, there are no important events or reports lined up in the EU. The US will release secondary reports like the producer price index and the consumer sentiment index from the University of Michigan. We do not expect these reports to provide direction for the pair.
Description of the chart:
Support and resistance levels are thick red lines near which the trend may end. They do not provide trading signals;
The Kijun-sen and Senkou Span B lines are the lines of the Ichimoku indicator, plotted to the 1H timeframe from the 4H one. They provide trading signals;
Extreme levels are thin red lines from which the price bounced earlier. They provide trading signals;
Yellow lines are trend lines, trend channels, and any other technical patterns;
Indicator 1 on the COT charts is the net position size for each category of traders;
Indicator 2 on the COT charts is the net position size for the Non-commercial group.