Analyzing Friday's trades:
GBP/USD on 1H chart
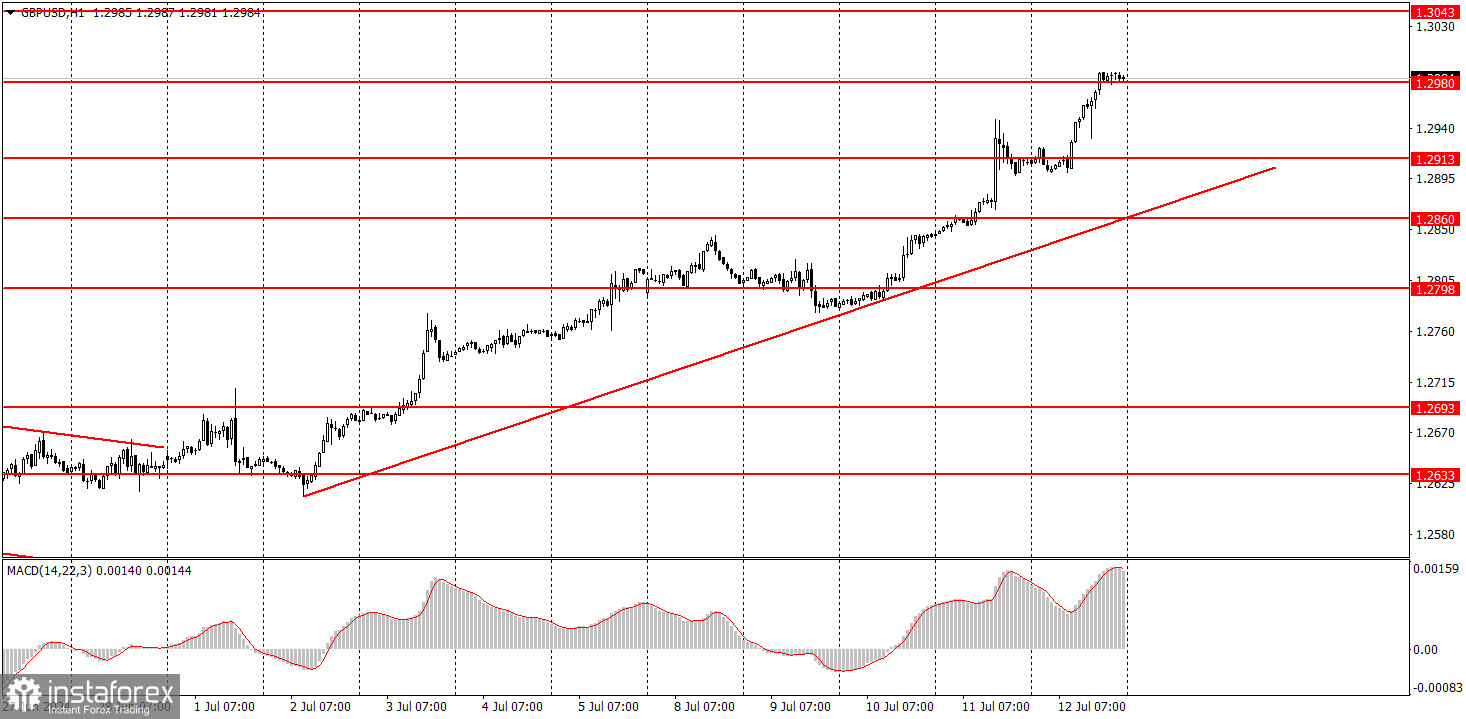
GBP/USD showed positive trades on Friday. The U.S. reports did not support the dollar, as the University of Michigan's consumer sentiment index turned out to be weaker than forecasted. However, at the same time, the Producer Price Index (which directly affects inflation and its slowdown that everyone is talking about) rose to 2.6%, even though forecasts predicted a value of 2.3-2.4%. The dollar should have strengthened after this report, but it only rose by 20 pips. Overall, the greenback lost 80 pips during the day. This is all you need to know about how the market is currently reacting to all the incoming reports. It seems that the dollar would have continued to drift lower even if there had been no U.S. reports scheduled for release on Friday.
By the way, the same goes for Federal Reserve Chief Jerome Powell's speeches. In both cases, Powell only mentioned that the Fed will cut rates when ready. For some reason, the market felt that Powell dropped a hint that it will happen in the near future so the market continued to sell the dollar.
GBP/USD on 5M chart
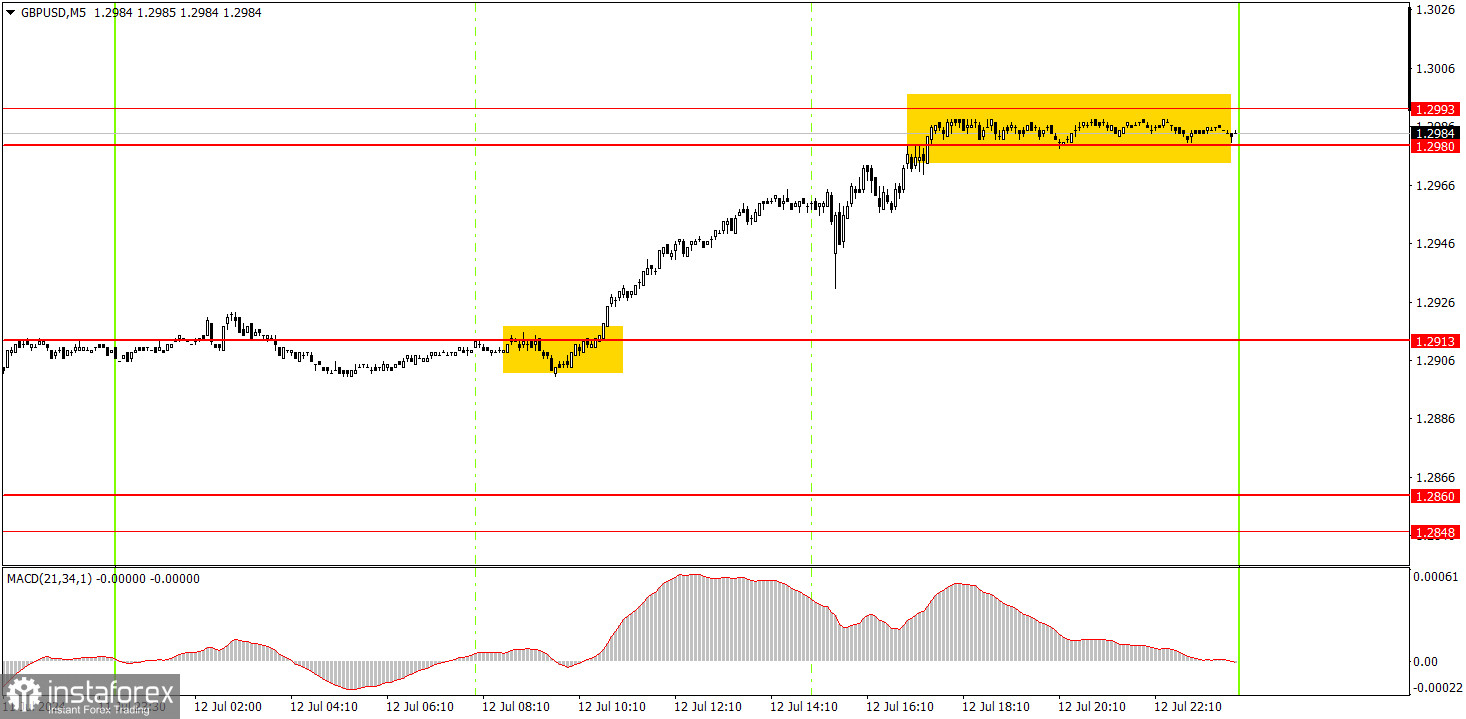
On the 5-minute timeframe, the pair formed a decent buy signal around the 1.2913 level. Subsequently, the price reached the 1.2980-1.2993 area, where traders could take profits on long positions. It is still quite difficult to believe that the pound will rise further, if only because the Bank of England is much closer to its first rate cut than the Fed. However, it is possible that the market is deliberately driving the pound higher to sell it at a more advantageous price later on.
Trading tips on Monday:
On the hourly chart, GBP/USD continues to show promising signs of forming a downtrend, but this doesn't mean that the pair can't form an upward trend. The pair has been rising again, and overall, it continues to exhibit erratic and illogical movements. Currently, the pound sterling has surpassed its latest local high and continues to ignore the fundamental backdrop. However, no one can deny that currently the economic reports have been supporting the pound.
On Monday, the pound sterling may start a new but weak downward movement to the 1.2913 level if it fails to overcome the 1.2980-1.2993 area. However, we don't expect a sharp decline unless the pound breaches the trend line. And even if it does, it might not happen altogether. This has been the case at least five times in recent months.
The key levels on the 5M chart are 1.2457, 1.2502, 1.2541-1.2547, 1.2605-1.2633, 1.2684-1.2693, 1.2748, 1.2791-1.2798, 1.2848-1.2860, 1.2913, and 1.2980. On Monday, there are no significant events scheduled in the UK, but the Fed head will give a speech in America. Powell's speech is the key event of the day, but his last two speeches did not provoke any market reaction, other than the market selling the dollar.
Basic trading rules:
1) Signal strength is determined by the time taken for its formation (either a bounce or level breach). A shorter formation time indicates a stronger signal.
2) If two or more trades around a certain level are initiated based on false signals, subsequent signals from that level should be disregarded.
3) In a flat market, any currency pair can produce multiple false signals or none at all. In any case, the flat trend is not the best condition for trading.
4) Trading activities are confined between the onset of the European session and mid-way through the U.S. session, after which all open trades should be manually closed.
5) On the 30-minute timeframe, trades based on MACD signals are only advisable amidst substantial volatility and an established trend, confirmed either by a trendline or trend channel.
6) If two levels lie closely together (ranging from 5 to 15 pips apart), they should be considered as a support or resistance zone.
How to read charts:
Support and Resistance price levels can serve as targets when buying or selling. You can place Take Profit levels near them.
Red lines represent channels or trend lines, depicting the current market trend and indicating the preferable trading direction.
The MACD(14,22,3) indicator, encompassing both the histogram and signal line, acts as an auxiliary tool and can also be used as a signal source.
Significant speeches and reports (always noted in the news calendar) can profoundly influence the price dynamics. Hence, trading during their release calls for heightened caution. It may be reasonable to exit the market to prevent abrupt price reversals against the prevailing trend.
Beginners should always remember that not every trade will yield profit. Establishing a clear strategy coupled with sound money management is the cornerstone of sustained trading success.