Analyzing Wednesday's trades:
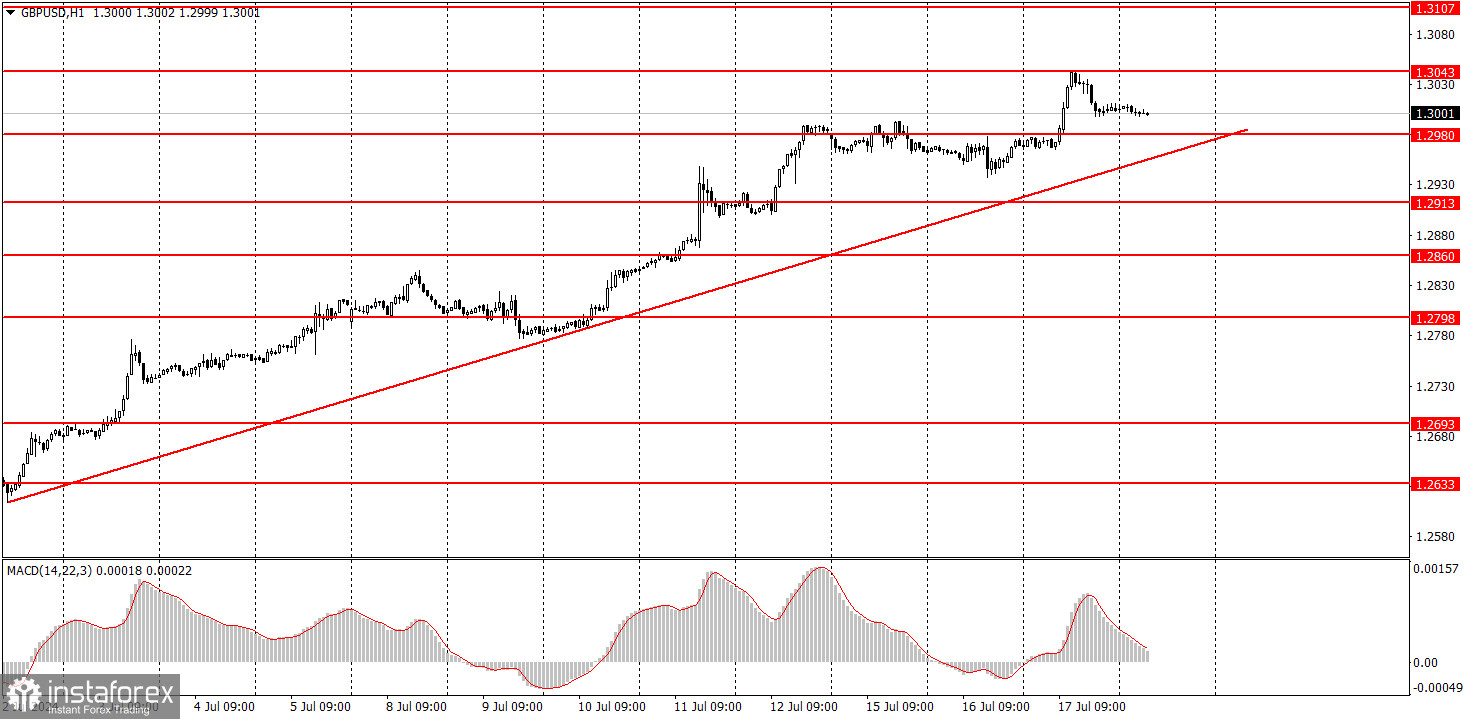
GBP/USD on 1H chart
GBP/USD resumed its upward movement on Wednesday according to the current upward trend. The trend line clearly indicates that the pound will continue to rise. However, this is no longer surprising, as the pound has shown an illogical rise for many months. Over the past three quarters, we have regularly drawn our readers' attention to the fact that there is no reason for the pound to rise, and yet it continues to show positive trades.
Once again there was no reason to buy the pound on Wednesday, but the market remains bullish. The UK Consumer Price Index rose by 2.0% in June, the same rate as the previous month. The Core CPI remained at 3.5%, the same as in May. However, the market was expecting inflation to ease. Why would that be a reason to open new long positions on the pound? After all, now the Bank of England may (hypothetically) consider that inflation has stopped falling and it is necessary to delay the first rate cut! These are the kind of reasons the market comes up with. In reality, the fact that inflation has fallen to the target level means that the BoE may start to lower its rate in August. And this should be a strong bearish factor for the pound.
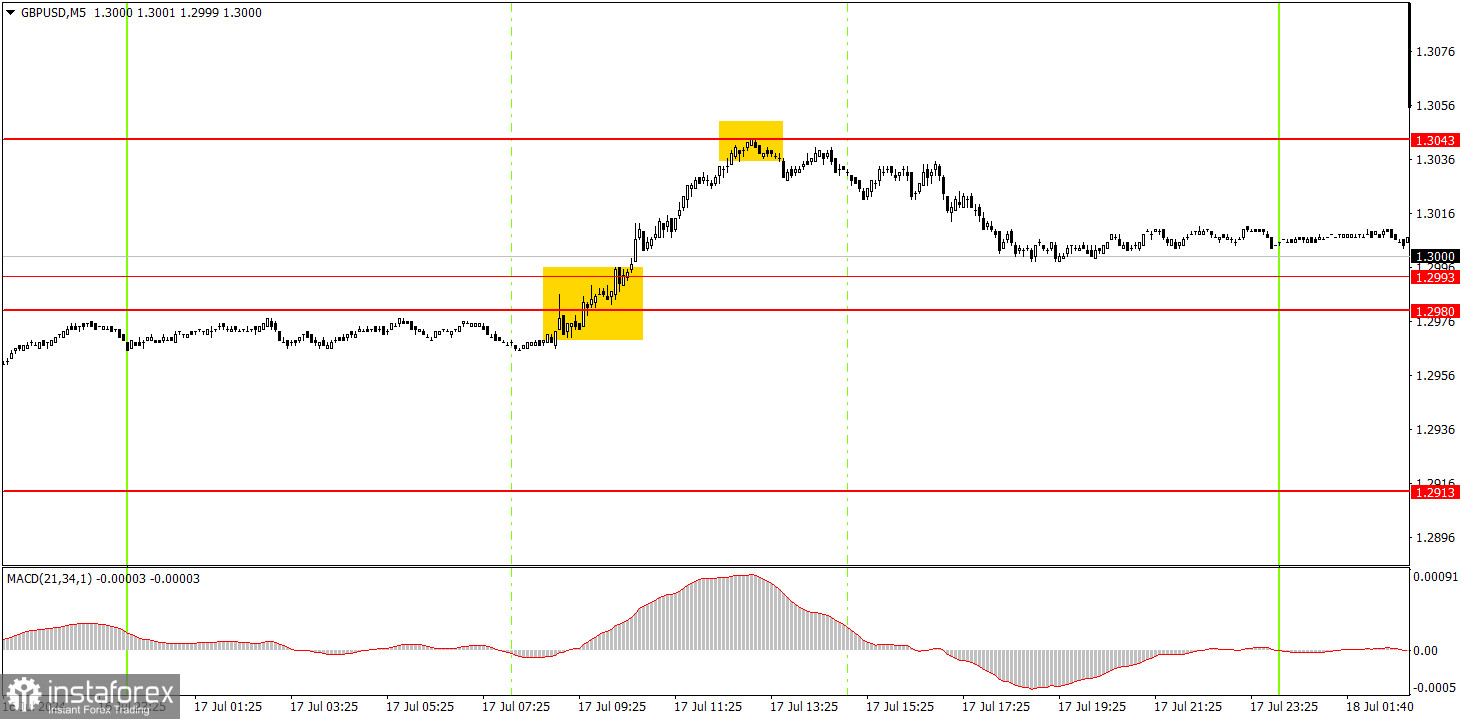
GBP/USD on 5M chart
Two decent trading signals were formed on the 5-minute timeframe. The price initially overcame the area of 1.2980-1.2993, which was a buy signal, and then it worked off and bounced from the level of 1.3043, which was a sell signal. Novice traders could open positions in both cases. The profit was about 20 pips in the first case, and it about 25 pips in the second.
Trading tips on Thursday:
On the hourly chart, GBP/USD continues to show promising signs of forming a downtrend, but this does not cancel the local upward trend. The pair shows bullish bias, and it continues to exhibit illogical movements. At this time, the pound sterling has surpassed its latest local high and continues to ignore the fundamental backdrop. The market also uses almost any report to buy the British currency.
On Thursday, the pound sterling may try to continue its upward movement, and novice traders can expect signals to form in the area of 1.2980-1.2993. A rebound from it indicates new positive trades. A consolidation below this mark suggests a sluggish fall.
The key levels on the 5M chart are 1.2605-1.2633, 1.2684-1.2693, 1.2748, 1.2791-1.2798, 1.2848-1.2860, 1.2913 , 1.2980-1.2993, 1.3043, 1.3102-1.3107, 1.3145. Today, the UK will release reports on unemployment and wages, which the market may use for new long positions. The US will publish a minor report on applications for unemployment benefits. The European Central Bank meeting and ECB Head Christine Lagarde's speech may also affect traders' sentiment for the pound.
Basic trading rules:
1) Signal strength is determined by the time taken for its formation (either a bounce or level breach). A shorter formation time indicates a stronger signal.
2) If two or more trades around a certain level are initiated based on false signals, subsequent signals from that level should be disregarded.
3) In a flat market, any currency pair can produce multiple false signals or none at all. In any case, the flat trend is not the best condition for trading.
4) Trading activities are confined between the onset of the European session and mid-way through the U.S. session, after which all open trades should be manually closed.
5) On the 30-minute timeframe, trades based on MACD signals are only advisable amidst substantial volatility and an established trend, confirmed either by a trendline or trend channel.
6) If two levels lie closely together (ranging from 5 to 15 pips apart), they should be considered as a support or resistance zone.
How to read charts:
Support and Resistance price levels can serve as targets when buying or selling. You can place Take Profit levels near them.
Red lines represent channels or trend lines, depicting the current market trend and indicating the preferable trading direction.
The MACD(14,22,3) indicator, encompassing both the histogram and signal line, acts as an auxiliary tool and can also be used as a signal source.
Significant speeches and reports (always noted in the news calendar) can profoundly influence the price dynamics. Hence, trading during their release calls for heightened caution. It may be reasonable to exit the market to prevent abrupt price reversals against the prevailing trend.
Beginners should always remember that not every trade will yield profit. Establishing a clear strategy coupled with sound money management is the cornerstone of sustained trading success.