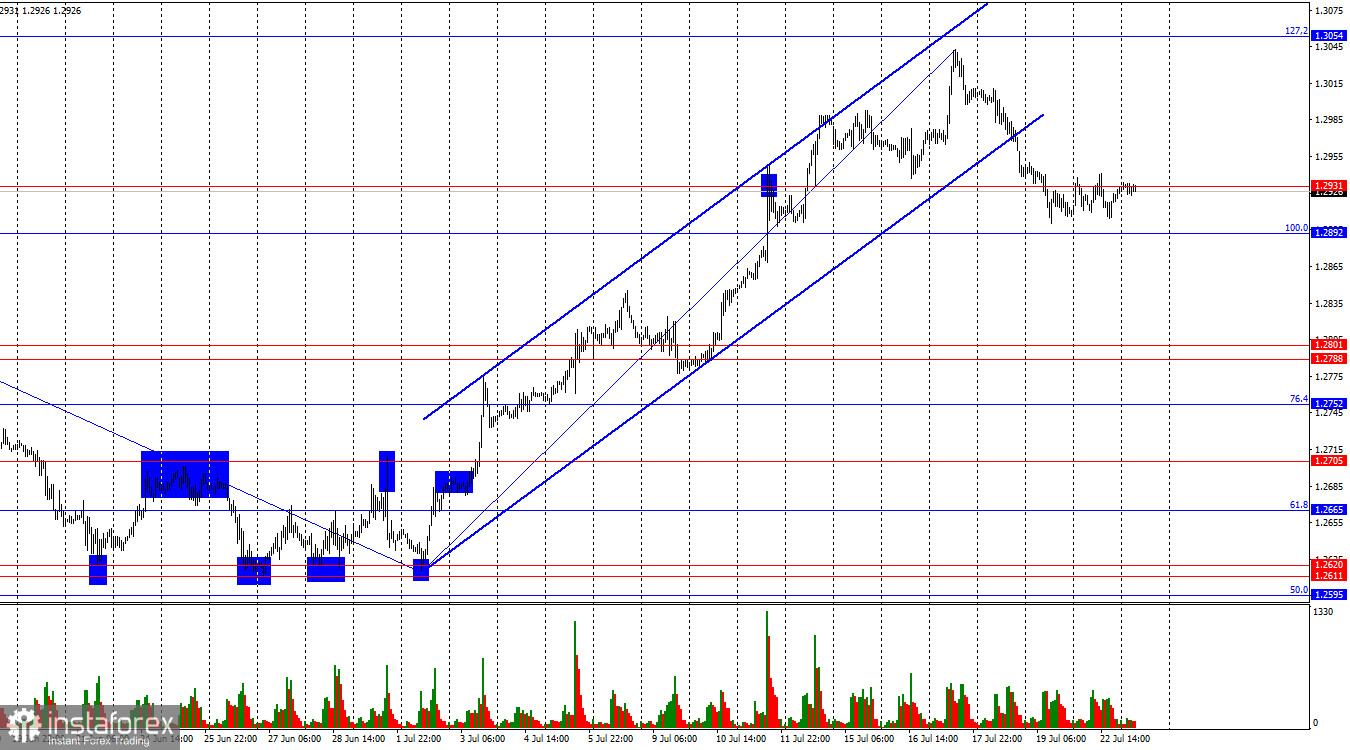
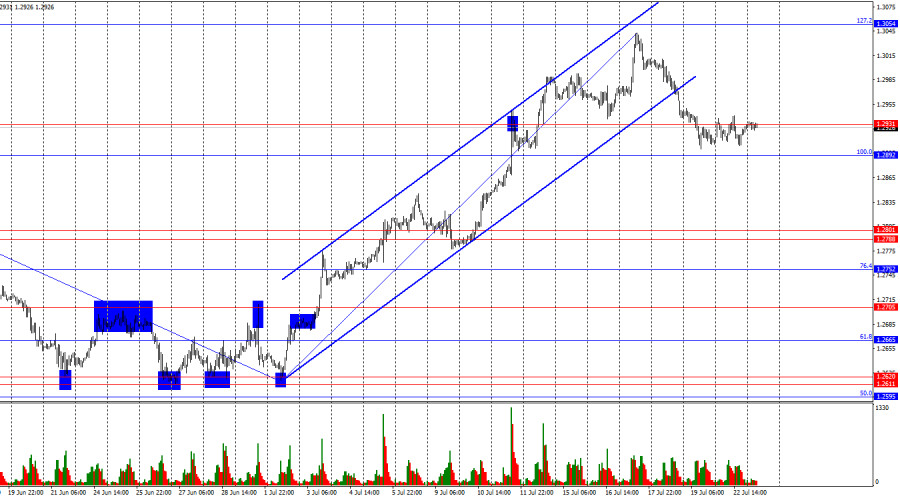
On the hourly chart, the GBP/USD pair remained in the support zone of 1.2892–1.2931 on Monday. Consolidation of quotes below this zone will allow the pound to continue declining towards the next support zone of 1.2788–1.2801. Consolidation above the 1.2892–1.2931 zone will favor the bulls again, and the pound may resume growth toward the corrective level of 127.2% – 1.3054. I do not expect significant movements today due to the lack of an information backdrop.
The wave situation changed last week. The last downward wave (which started forming on June 12th) managed to break the low of the previous downward wave, while the last upward wave managed to break the peak of the previous upward wave. Thus, we saw a trend change to "bullish" after a "bearish" one, which has not yet been realized. The pound's growth may continue, but traders must now form at least a corrective downward wave. From a wave point of view, there is currently no talk of a trend change to "bearish." For this to happen, the pair must break the low from July 2nd. It remains uncertain whether the bears have enough strength for this.
The information backdrop on Monday did not provide any new opportunities for traders. The pound made the first step towards a "bearish" trend, and not only are graphical signals important, but also the actions of traders. In our case, the bears. If the bears continue to hesitate, there will be no strong decline in the pound. The bears are currently hesitating, mainly because of the uncertainty of whether the Bank of England will be ready to start easing monetary policy in August. It doesn't matter when exactly the regulator will start easing. Inflation has decreased to the target level, so a rate cut will begin in the near future anyway. Traders worry that the Bank of England will again leave rates unchanged in August, while the Fed may start easing in September. Thus, the information backdrop does not strongly support the bears.
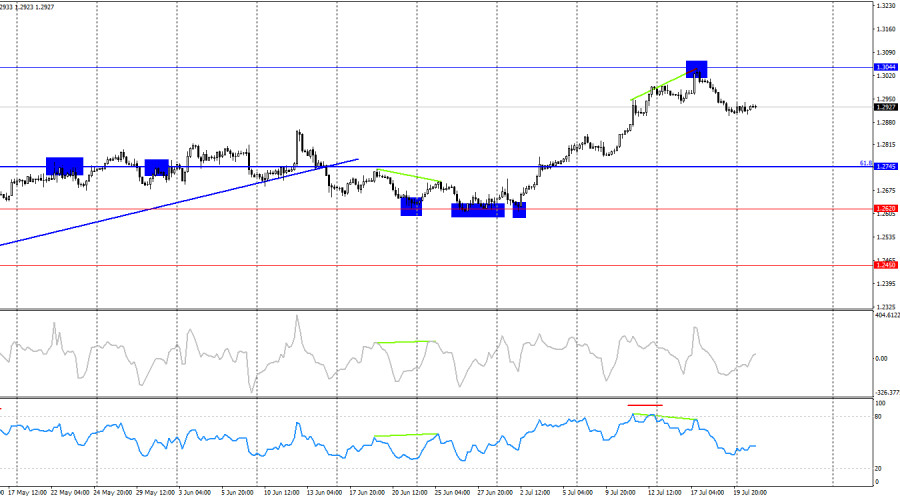
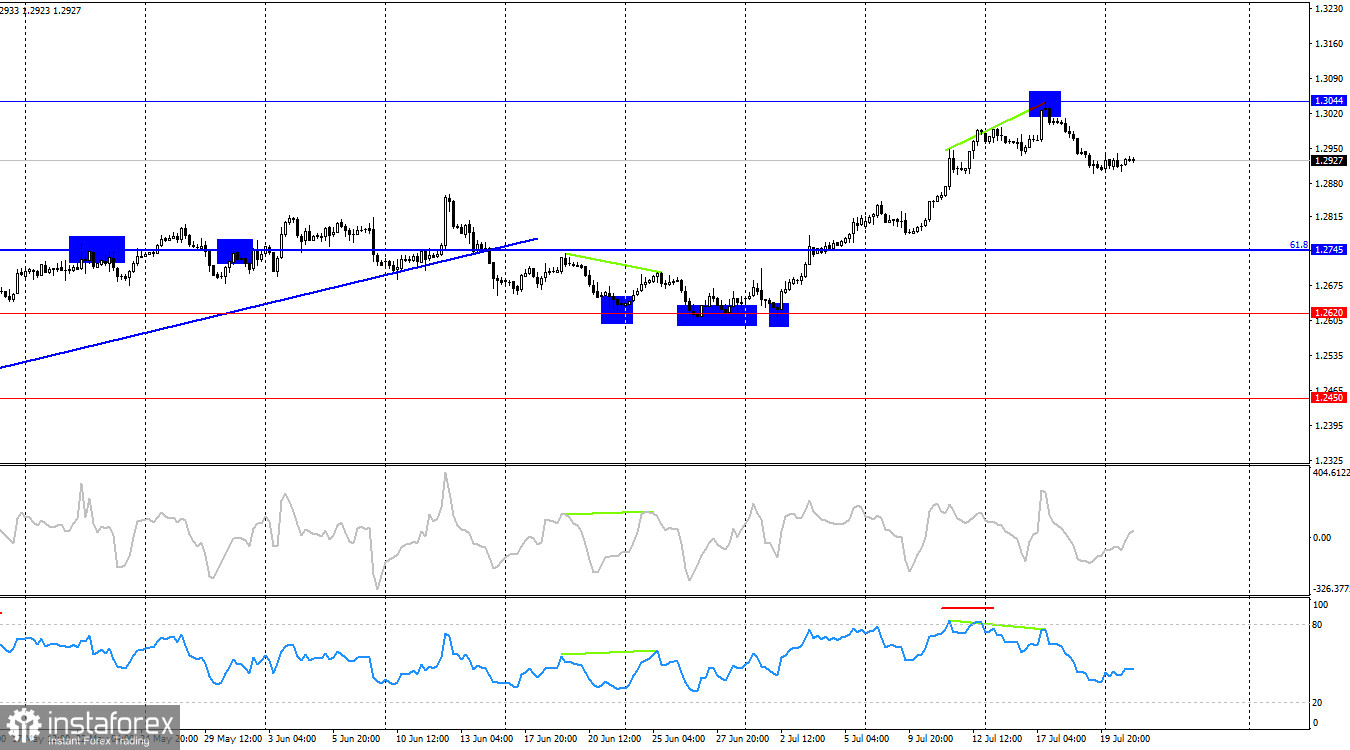
On the 4-hour chart, the pair rebounded from the 1.3044 level, forming a "bearish" divergence on the RSI indicator. This same indicator had earlier entered the overbought zone. Thus, several sell signals were received on the higher chart. The decline may continue towards the 61.8% corrective level at 1.2745, as the bears closed below the trend channel on the hourly chart.
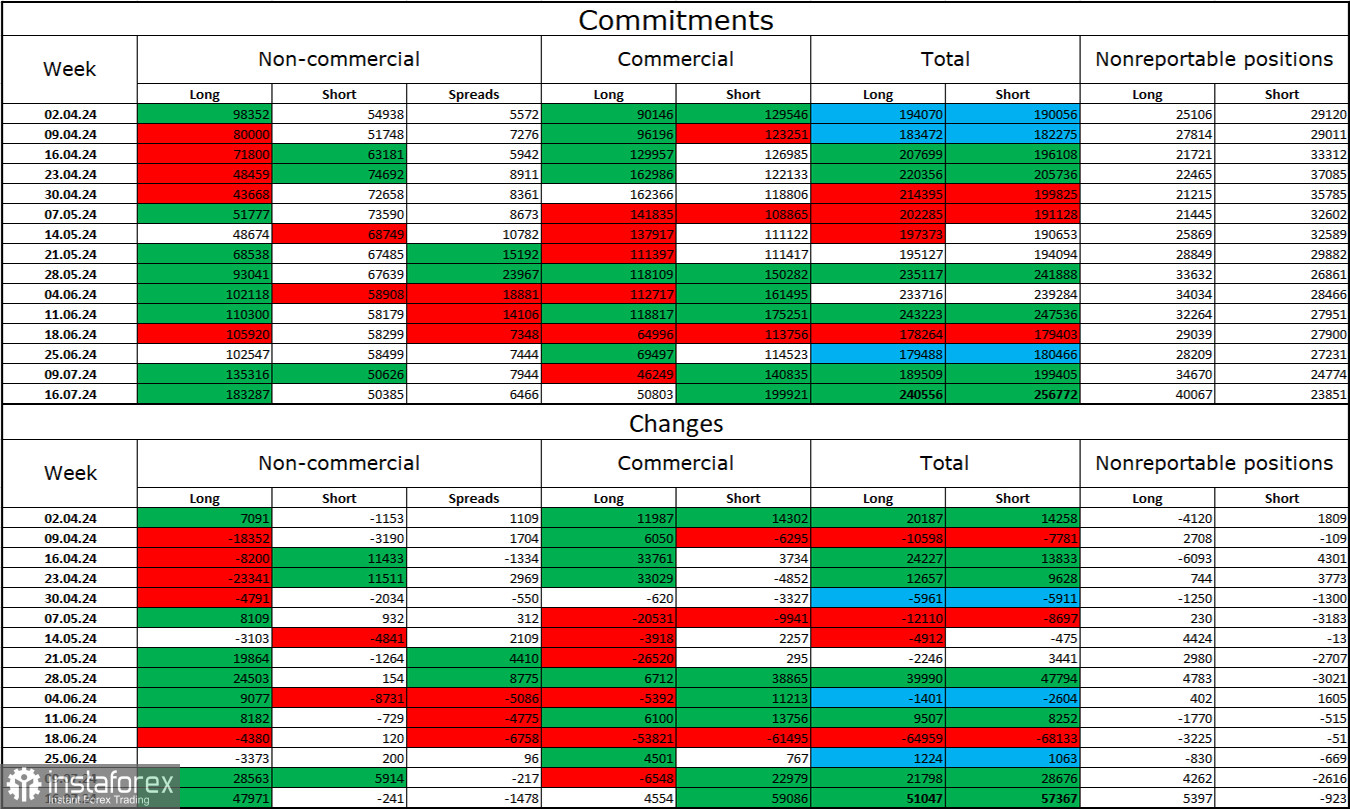
Commitment of Traders (COT) Report:
The sentiment of the 'Non-commercial' trader category became even more 'bullish' over the past reporting week. The number of long positions held by speculators increased by 47,971 units, while the number of short positions decreased by 241. The bulls still have a solid advantage. The gap between long and short positions is now 133 thousand: 183 thousand versus 50 thousand.
The prospects for the pound's decline remain, but the COT reports currently suggest otherwise. Over the past three months, the number of long positions has increased from 98 thousand to 183 thousand, while the number of short positions has decreased from 54 thousand to 50 thousand. Over time, professional traders will start reducing long positions or increasing short positions again, as all possible factors for buying the British pound have already been exhausted. However, this is just an assumption. Graphical analysis suggests a likely decline, but this does not negate the weakness of the bears, who could not even break through the 1.2620 level.
News Calendar for the USA and the UK: USA – Home Sales (14:00 UTC).
The economic events calendar contains only one entry for the USA on Tuesday. The information backdrop's influence on market sentiment today will be extremely weak.
Forecast for GBP/USD and Trader Tips:
The pound's sales were possible on a rebound from the 1.3044 level on the 4-hour chart, with the target of the lower boundary of the upward channel. Now, these sales can be closed or held in anticipation of a close below the 1.2892–1.2931 zone on the hourly chart. I do not consider purchases advisable in the next couple of days.
The Fibonacci level grids are built at 1.2892–1.2298 on the hourly chart and at 1.4248–1.0404 on the 4-hour chart.