Analysis of EUR/USD 5M
On Wednesday, EUR/USD attempted to continue its downward movement. However, the euro began to rise during the U.S. session, which could have been triggered by another set of weak U.S. reports. This time, the Manufacturing PMI index fell short of forecasts and dropped below the "waterline" of 50.0. It is worth noting that in the U.S., there are "domestic" business activity indices, such as the ISM, which have much greater significance and influence on the dollar's exchange rate. However, as Wednesday showed, the market is ready to sell the dollar on any events and reports. At the beginning of the week, we had warned readers that an upward correction was possible, after which the overall decline would resume. So far, everything is going as planned.
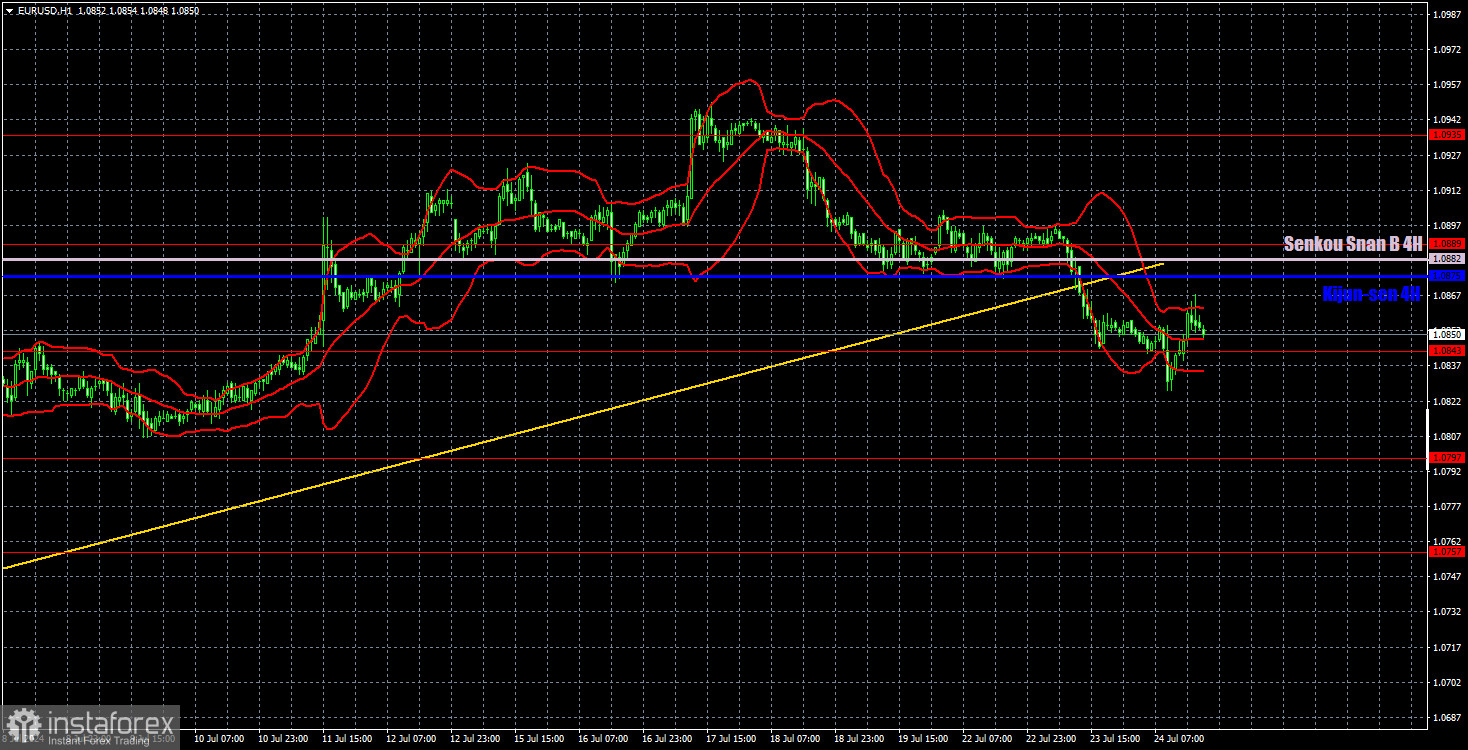
In the hourly timeframe, the pair settled below the ascending trendline, indicating a shift to a downward trend. Thus, we can expect the euro to decline in the coming weeks. It's also worth noting that we have a range between 1.06 and 1.10 in the 24-hour timeframe. Since the price recently reached the upper end of this range, it is now logical to expect a drop to the lower end. As for the fundamental and macroeconomic background, it is either one-sidedly priced in by the market or is inherently unable to support the dollar.
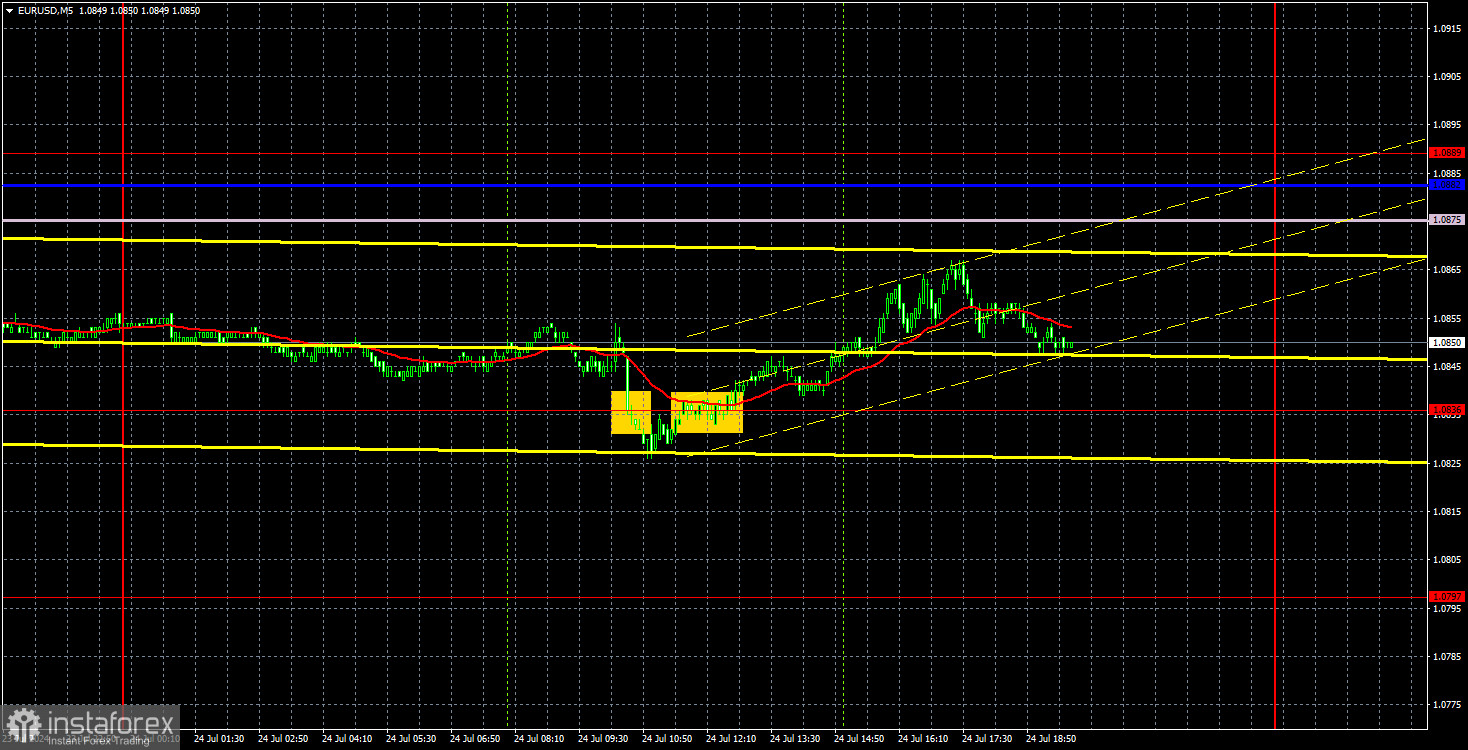
Two trading signals were generated in the 5-minute timeframe yesterday, but let's start with volatility. It once again showed a super-low value of 40 pips. Therefore, expecting good signals, movements, and profits was inherently tricky. Initially, the pair settled below the 1.0836 level on European data, leaving much to be desired. Then, it settled above this level. The second buy signal could have brought a small profit, but the first closed with a loss.
COT report:
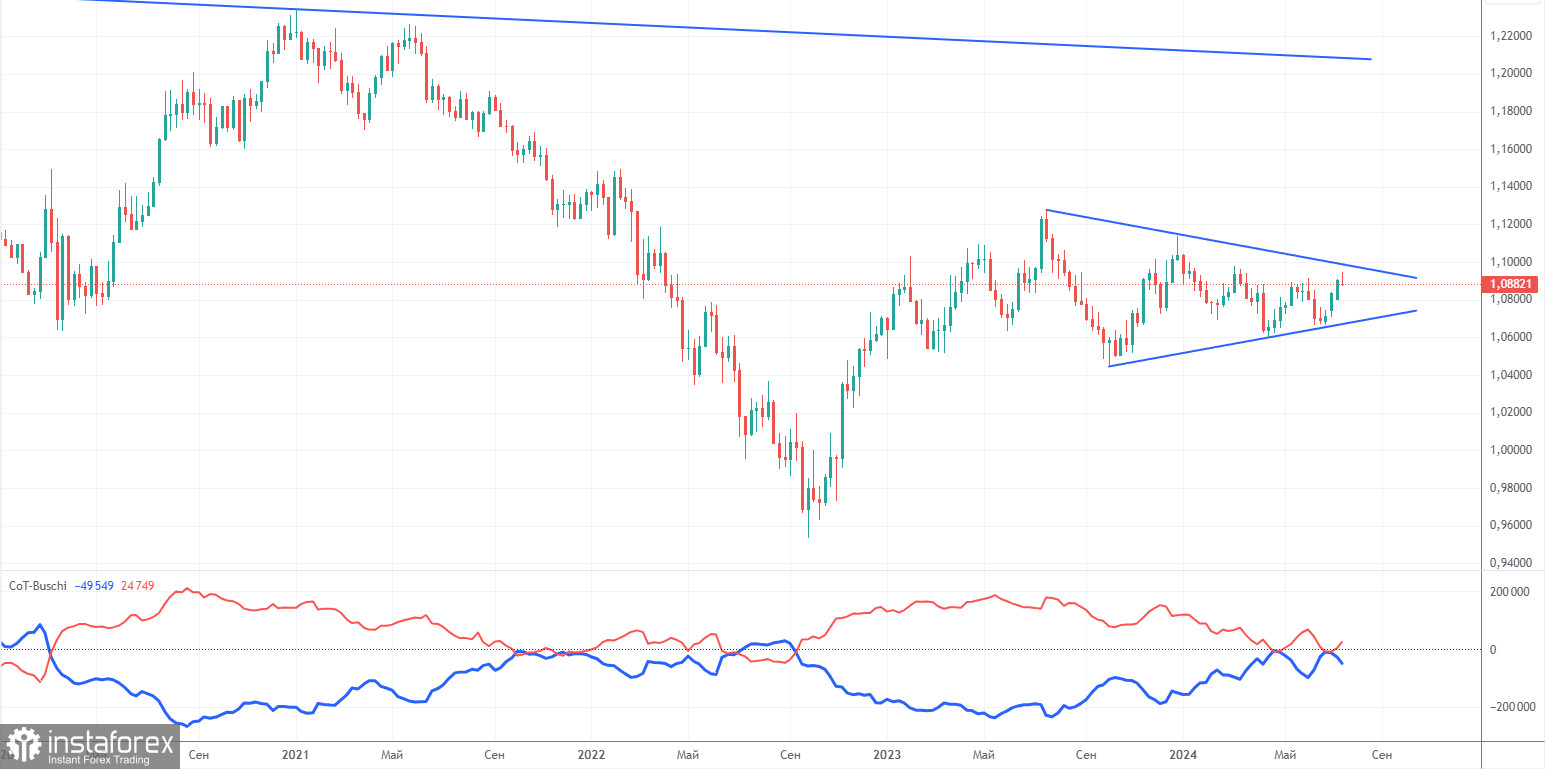
The latest COT report is dated July 16. The net position of non-commercial traders has remained bullish for a long time. The bears' attempt to gain dominance failed miserably. In recent months, the net position of non-commercial traders (red line) has been declining, while that of commercial traders (blue line) has been growing. They are now approximately equal, indicating a new attempt by the bears to take the initiative.
We still do not see any fundamental factors that can support the euro to strengthen further, and technical analysis indicates that the price is in a consolidation zone—within a triangle. The future movement of the pair will depend on which boundary the price leaves through.
The red and blue lines are approaching each other, indicating a build-up in short positions in the euro. During the last reporting week, the number of long positions for the non-commercial group increased by 14,100, while the number of short positions decreased by 7,000. As a result, the net position increased by 21,100. According to the COT reports, the euro has a significant potential for a decline.
Analysis of EUR/USD 1H
In the hourly time frame, EUR/USD settled below the trendline, suggesting a potential decline for the euro. Almost all the economic reports over the past three weeks have had a destructive impact on the dollar, even when the data were favorable for it. Wednesday is no exception. The global downtrend persists in the 24-hour timeframe, meaning the pair could still fall back to the 1.06 level. Currently, the market is showing flat dynamics in the daily timeframe.
On July 25, we highlight the following levels for trading: 1.0530, 1.0581, 1.0658-1.0669, 1.0757, 1.0797, 1.0843, 1.0889, 1.0935, 1.1006, 1.1092, as well as the Senkou Span B (1.0882) and Kijun-sen (1.0875) lines. The Ichimoku indicator lines may shift throughout the day, which should be considered when identifying trading signals. Remember to set a Stop Loss to breakeven if the price has moved in the intended direction by 15 pips. This will protect you against potential losses in case of false signals.
On Thursday, notable events include a speech by ECB President Christine Lagarde, as well as U.S. reports on durable goods orders and GDP for the second quarter. Each of these events could provoke a market reaction, but given the overall volatility of the pair, strong movements are unlikely today.
Description of the chart:
Support and resistance levels are thick red lines near which the trend may end. They do not provide trading signals.
The Kijun-sen and Senkou Span B lines are the lines of the Ichimoku indicator, plotted to the 1H timeframe from the 4H one. They are strong lines.
Extreme levels are thin red lines from which the price bounced earlier. They provide trading signals;
Yellow lines are trend lines, trend channels, and any other technical patterns.
Indicator 1 on the COT charts is the net position size for each category of traders.