Analyzing Tuesday's trades:
GBP/USD on 1H chart
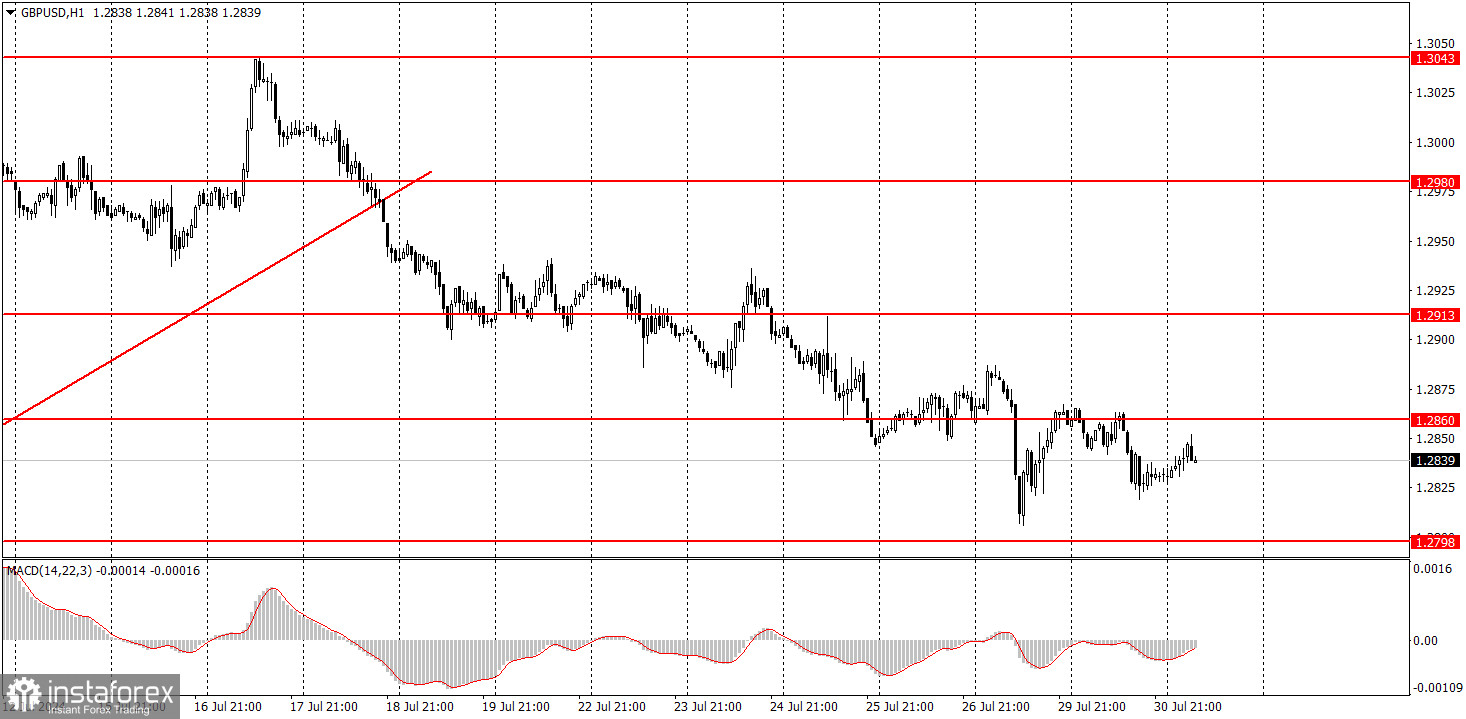
The GBP/USD pair also tried to sustain its decline on Tuesday, although there were a few local reasons for this. The only important report of the day – the U.S. JOLTs report – turned out to be stronger than expected, but it was only after its release that the dollar stopped appreciating. We believe the British pound continues to fall due to technical factors and expectations of the Bank of England's upcoming rate cut. In addition, the general overvaluation of the pound and its somewhat unjustified growth over the past three months play a role.
Unfortunately, market volatility remains very weak. The Federal Reserve meeting will take place today, but no exciting developments from the U.S. central bank are expected at this time. However, tomorrow's BoE meeting could trigger a new decline in the pound. The market allows for the possibility of rate cuts but does not fully believe in it. If the BoE maintains the key rate at its highest level, this could become a basis for the British currency's growth.
GBP/USD on 5M chart
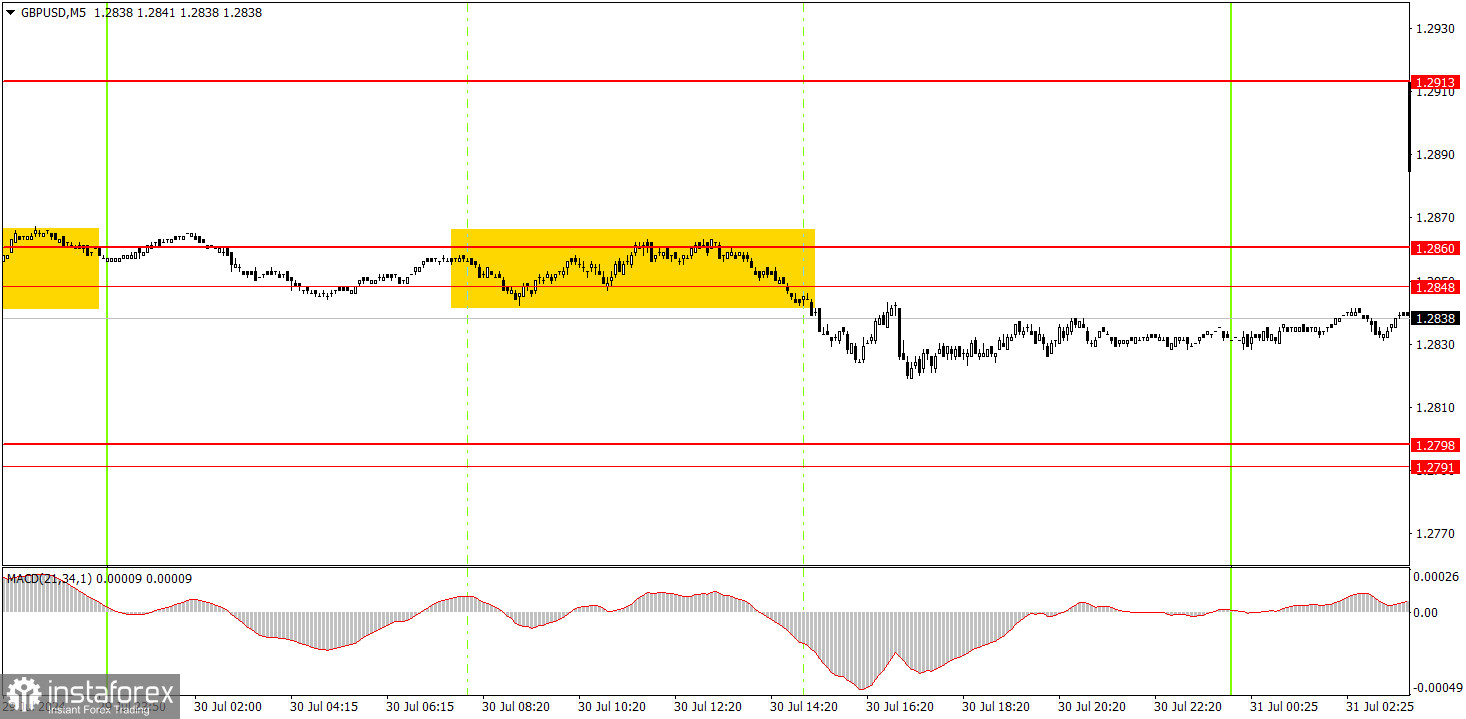
One trading signal was generated in the 5-minute time frame. The price traded within the 1.2848-1.2860 range throughout the European session and settled below it. The pound may continue to fall today with a target of 1.2791-1.2798, which is unlikely to be swift. As mentioned earlier, the current volatility values suggest staying in the trade for two to three days.
Trading tips on Wednesday:
In the hourly time frame, GBP/USD finally has a chance to start a downward trend. The pair has breached the ascending trendline, so we might observe a decline for at least a couple of weeks rather than growth. Ideally, the pound should drop by at least 400-500 pips. The market has processed all the bullish factors multiple times, the dollar is undervalued, and the BoE may start lowering its rates as early as this week. The British currency has more reasons to fall than to rise.
On Wednesday, novice traders may trade within the range of 1.2848-1.2860. If the price bounces from this range, traders may hold on to short positions with the previously mentioned targets.
The key levels to consider on the 5M timeframe are 1.2605-1.2633, 1.2684-1.2693, 1.2748, 1.2791-1.2798, 1.2848-1.2860, 1.2913, 1.2980-1.2993, 1.3043, 1.3102-1.3107, 1.3145. Today, there are no significant events scheduled in the UK. Meanwhile, the U.S. will release the ADP report on changes in the number of workers in the non-agricultural sector (comparable to NonFarm Payrolls), which is of moderate importance. The Fed meeting in the evening will not affect the pair's movement during the day.
Basic rules of a trading system:
1) The strength of a signal is determined by the time it took for the signal to form (bounce or level breakthrough). The shorter the time required, the stronger the signal.
2) If two or more trades around a certain level are initiated based on false signals, subsequent signals from that level should be ignored.
3) In a flat market, any currency pair can produce multiple false signals or none at all. In any case, it's better to stop trading at the first signs of a flat market.
4) Trades should be opened between the start of the European session and mid-way through the U.S. session. All trades must be closed manually after this period.
5) In the hourly time frame, trades based on MACD signals are only advisable amidst substantial volatility and an established trend, confirmed either by a trendline or trend channel.
6) If two levels are too close to each other (from 5 to 20 pips), they should be considered as a support or resistance zone.
7) After moving 15 pips in the intended direction, the Stop Loss should be set to break-even.
What's on the charts:
Support and Resistance price levels can serve as targets when buying or selling. You can place Take Profit levels near them.
Red lines represent channels or trend lines that depict the current trend and indicate the preferred trading direction.
The MACD (14,22,3) indicator, encompassing both the histogram and signal line, acts as an auxiliary tool and can also be used as a source of signals.
Important speeches and reports (always noted in the news calendar) can profoundly influence the price dynamics. Hence, trading during their release calls for heightened caution. It may be reasonable to exit the market to prevent abrupt price reversals against the prevailing trend.
Beginners should always remember that not every trade will yield profit. Establishing a clear strategy, coupled with effective money management, is key to long-term success in trading.