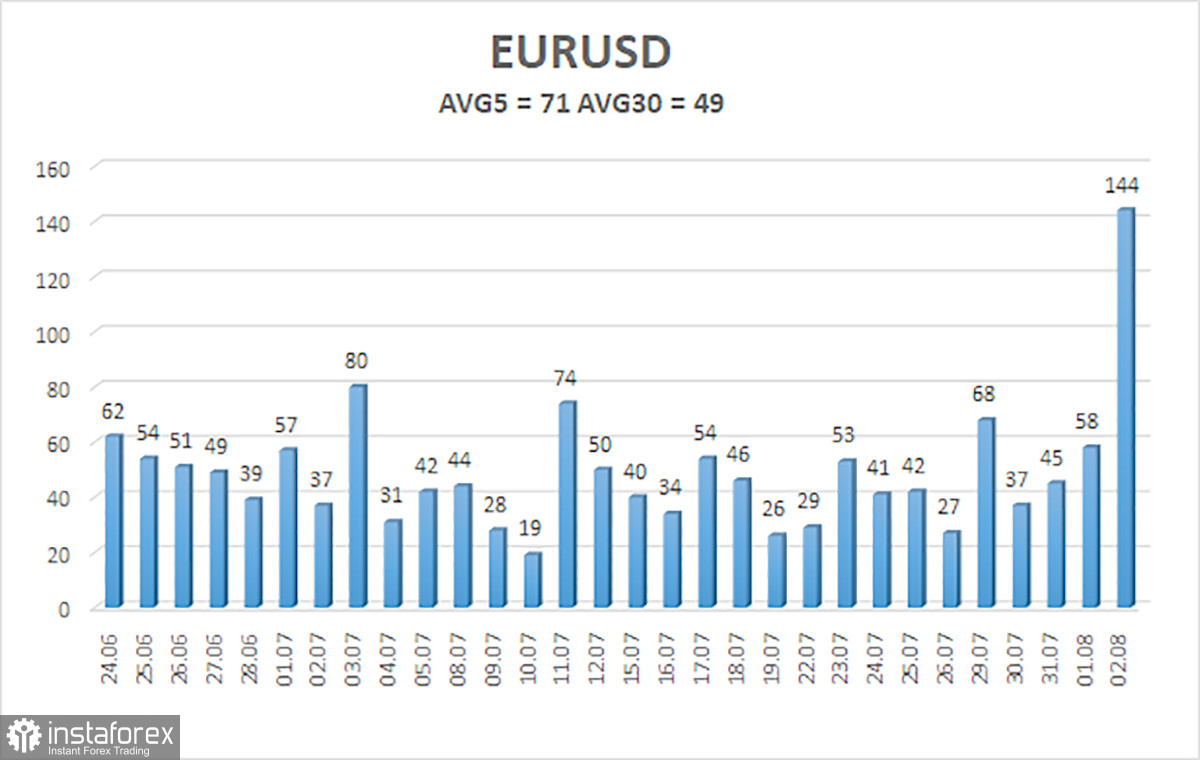
EUR/USD rose more than 100 pips on Friday. We haven't seen such volatility for a long time, but we want to remind traders that it's not just one day that's important, but the trend. If we see movements of only 30-40 pips again this week, the Friday surge will have been meaningless. The illustration below shows that volatility over 100 pips is an isolated case.
Why did the U.S. dollar collapse? The answer to this question is so simple that it's evident to every trader. U.S. Nonfarm Payrolls showed disappointing figures for the fourth consecutive time, showing only 114,000 in July against forecasts of 175-190,000. Moreover, June's figures were revised downward—from 206,000 to 179,000. In addition, the unemployment rate rose from 4.1% to 4.3%, which no expert had predicted. Thus, two of the most important reports, three crucial figures, failed spectacularly. No wonder the U.S. currency plummeted.
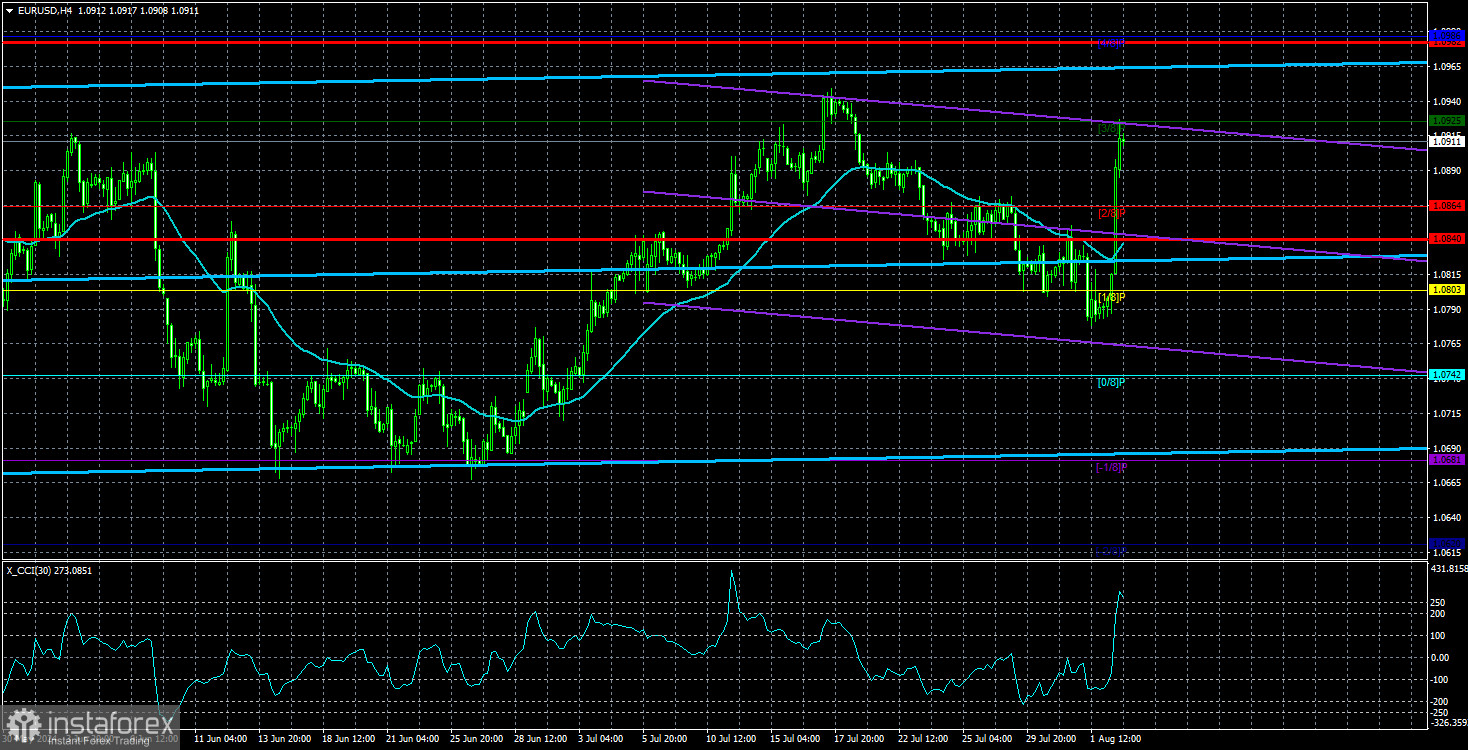
From a medium-term and technical perspective, practically everything has stayed the same for the EUR/USD pair. It still trades within the horizontal channel of 1.06-1.10. Therefore, we would not rush to conclude that "all is lost." Yes, the dollar suffered another crash due to macroeconomic data, but at the same time, the overall fundamental background has not changed. The European Central Bank is still cutting key rates, and the Federal Reserve is still not lowering them.
Moreover, the CCI indicator has entered the overbought area for the second time. We have repeatedly said in recent months that the euro in 2024 shows growth more often than necessary. Despite the overall decline of the euro, in our opinion, it should be much lower than current levels. Therefore, unless the price firmly consolidates above the horizontal channel on the daily time frame, we do not believe the euro will sustain its growth.
This week, the pair might return to a downward trend. Even in the 4-hour time frame, it's evident that a new downward movement has started, after which the price sharply corrected higher, suggesting a new bearish phase might begin now. Of course, the U.S. macro data continue to show the same values as in the last 3-4 months; it will be extremely difficult for the dollar to expect any solid growth. Earlier this year, and then in spring, when we expected the pair to be around the level of 1.02 or even lower—near price parity—we did not anticipate that at some point, the economic reports would start showing results not comparable to the dollar's growth.
However, many U.S. reports in recent months have not been disappointing because of their actual values but because they did not meet market expectations. In other words, the market expects and continues to expect values that are too high from U.S. indicators, thus repeatedly facing disappointment.
The average volatility of EUR/USD over the past five trading days as of August 5 is 71 pips, which is considered low. We expect the pair to move between the levels of 1.0840 and 1.0982 on Monday. The higher linear regression channel is directed upwards, but the global downward trend persists. The CCI indicator entered the overbought area, again warning of a potential shift to a downtrend.
Nearest Support Levels:
- S1 – 1.0864
- S2 – 1.0803
- S3 – 1.0742
Nearest Resistance Levels:
- R1 – 1.0925
- R2 – 1.0986
- R3 – 1.1047
Trading Recommendations:
The EUR/USD pair maintains a global downward trend; a weak decline continues in the 4-hour time frame. In previous reviews, we mentioned that we are only expecting the continuation of the global downward trend. We do not believe the euro can start a new global trend amid the ECB's monetary policy easing, so the pair will likely fluctuate between 1.0600 and 1.1000 for some time. Since the price has reversed in the upper part of this range, short positions with targets around the Murray level "-1/8" - 1.0681 remain valid.
Explanations for Illustrations:
Linear Regression Channels: help determine the current trend. If both are directed in the same direction, it means the trend is strong.
Moving Average Line (settings 20,0, smoothed): determines the short-term trend and the direction in which trading should be conducted.
Murray Levels: target levels for movements and corrections.
Volatility Levels (red lines): the probable price channel in which the pair will spend the next 24 hours, based on current volatility indicators.
CCI Indicator: Entering the oversold area (below 250) or the overbought area (above +250) means a trend reversal is approaching.