The GBP/USD pair also showed no desire to move on Friday. The price corrected to the moving average, where the trading week ended. It is worth noting that the British pound has been falling for three and a half weeks straight, which is rare for it. Moreover, it fell almost continuously against the dollar last week while many other currencies rose, which is unusual. However, considering the overall fundamental backdrop in 2024 and the general technical picture, nothing is surprising about the British currency's decline. While the market has been waiting (for seven months) for the Federal Reserve to "lower the key rate at the next meeting," the Bank of England has already begun easing its monetary policy, immediately following the European Central Bank. Thus, the U.S. dollar currently has an advantage over the euro and the pound. Unfortunately, the market only focuses on weak U.S. data and the upcoming Fed rate cut. Everything else is of little interest.
This week, there will be several important events in the UK. Specifically, reports on unemployment, wages, jobless claims, inflation, second-quarter GDP, industrial production, and retail sales can be highlighted. Of course, the key report will be on inflation, which, along with the U.S. inflation report, could determine the pair's direction for the next few weeks. If UK inflation increases to 2.3% or higher (as experts predict), the BoE might take a pause at the next meeting. If U.S. inflation falls to 2.9%, we believe this will not be enough for the Fed to begin rate cuts in September. However, the market will start to believe even more in a September easing. Combined, these two reports could provoke a sharp decline in the U.S. dollar.
We will highlight the UK GDP among other reports, though with some reservations. All other reports may trigger intraday market reactions, which are unlikely to affect the overall market sentiment. Therefore, everything will depend on the two inflation reports.
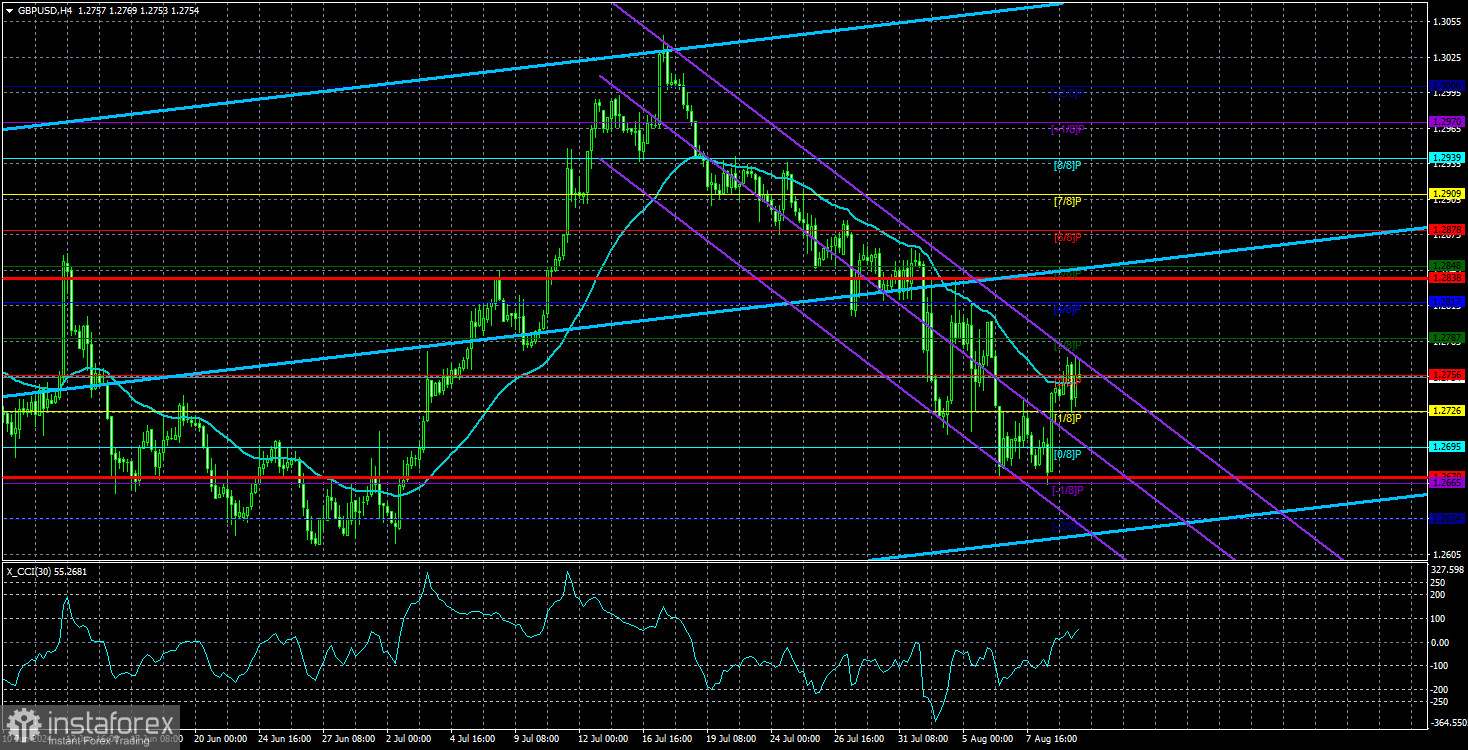
The technical picture currently allows for both a correction and a continuation of the downward movement, so in the early days of the new week, it's helpful to focus on the price's position relative to the moving average. A firm hold above this line might indicate that the pound is ready to correct after three weeks of decline. A drop below the moving average would signal the market's readiness to continue selling. However, it should be noted that the British and U.S. inflation data could dramatically change market sentiment.
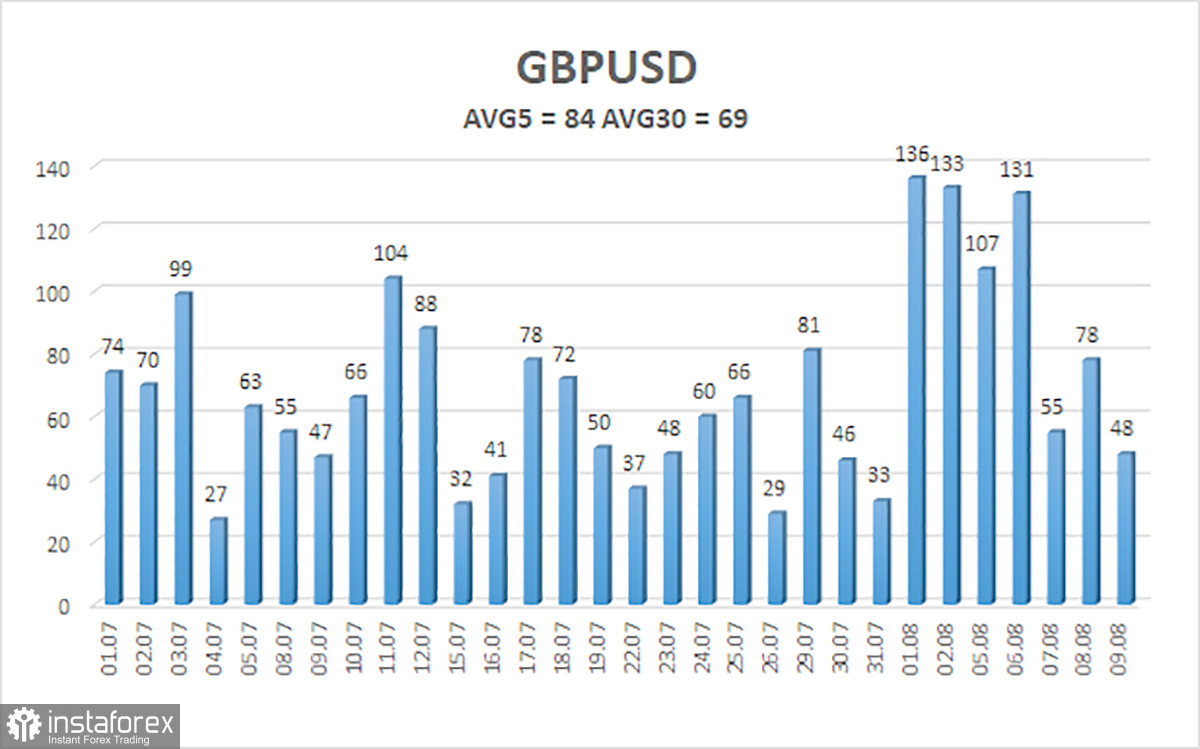
The average volatility of GBP/USD over the last five trading days is 84 pips. This is considered an average value for the pair. Therefore, on Monday, August 12, we expect movement within the range limited by 1.2670 and 1.2838. The higher linear regression channel is directed upwards, indicating that the uptrend remains intact. The CCI indicator has formed an oversold condition and a bullish divergence. A correction has already begun and may continue this week.
Nearest Support Levels:
- S1 – 1.2726
- S2 – 1.2695
- S3 – 1.2665
Nearest Resistance Levels:
- R1 – 1.2756
- R2 – 1.2787
- R3 – 1.2817
Trading Recommendations:
The GBP/USD pair remains below the moving average line and has a good chance of sustaining its bearish momentum. Short positions remain valid with initial targets at 1.2665 and 1.2634. We are not considering long positions at this time, as we believe that the market has already processed all the bullish factors for the British currency (which are not much) multiple times. The pound may continue to correct this week, as warned by the CCI indicator, but whether or not the correction will occur is up to the traders to decide. The pound will have a good chance to show growth after the U.S. and the UK inflation reports.
Explanations for Illustrations:
Linear Regression Channels: help determine the current trend. If both are directed in the same direction, it means the trend is strong.
Moving Average Line (settings 20,0, smoothed): determines the short-term trend and the direction in which trading should be conducted.
Murray Levels: target levels for movements and corrections.
Volatility Levels (red lines): the probable price channel in which the pair will spend the next 24 hours, based on current volatility indicators.
CCI Indicator: Entering the oversold area (below 250) or the overbought area (above +250) means a trend reversal is approaching.