In my morning forecast, I focused on the 1.2821 level and planned to make trading decisions based on it. Let's look at the 5-minute chart and analyze what happened. The decline and the formation of a false breakout at 1.2821 created a buying opportunity for the pound, resulting in a 30-point increase for the pair. The technical outlook has been partially revised for the second half of the day.
To Open Long Positions on GBP/USD:
Pound buyers reacted quickly to the news of slowing inflation growth in the UK, re-entering the market around the 1.2821 level. Now, everything will depend on the U.S. statistics. The Consumer Price Index (CPI) and Core CPI, excluding food and energy prices, will be the key events, and any reduction in these figures could trigger a new wave of pound growth. If the pound reacts negatively to the data, the morning support at 1.2821 can still be used, where a formation of a false breakout, similar to the one discussed earlier, would provide a suitable scenario for opening long positions, targeting a rise to the resistance at 1.2869, formed in the first half of the day. A breakout and retest of this range from top to bottom on news of declining U.S. inflation would increase the chances of the pound rising, leading to an entry point with the potential to reach 1.2910. The furthest target would be the 1.2939 level, where I plan to take profits. If GBP/USD declines and there is no activity from bulls around 1.2821, where the moving averages are also located, the pound could drop more significantly. This would lead to a test of the next support level at 1.2780, increasing the chances of a more substantial fall in the pair. Therefore, only a false breakout at this level would be a suitable condition for opening long positions. I would consider buying GBP/USD immediately on a rebound from the 1.2731 level, targeting an intraday correction of 30-35 points.
To Open Short Positions on GBP/USD:
Sellers have proven they are still in the game, and now everything depends on the data. If the pair rises due to U.S. economic data, a false breakout at 1.2869 would signal the involvement of major players betting on a decline in the pound, creating an opportunity to enter new short positions with the target of testing the 1.2821 support, which did not break in the first half of the day. A breakout and subsequent retest of this level from below would undermine the buyers' positions, trigger stop-loss orders, and pave the way to 1.2780. The farthest target would be the 1.2731 level, where I plan to take profits. Testing this level would significantly weaken the bullish outlook for the pound. If GBP/USD rises and there is no activity around 1.2869 in the second half of the day, which is more probable, buyers would have a strong chance to continue the pair's uptrend. In this scenario, I would delay selling until a false breakout at 1.2910 occurs. If no downward movement is observed, I would sell GBP/USD immediately on a rebound from 1.2939, targeting a 30-35 point downward correction.
On August 6, there was a significant reduction in long positions and a slight decrease in short positions. This shift is understandable, as the Bank of England has indicated its intention to cut interest rates following its recent meeting. With the economy needing support after inflation has been controlled, it is anticipated that the British regulator will implement at least one rate cut this fall, which could limit the pound's medium-term upward potential. The latest COT report shows that long non-commercial positions decreased by 39,555 to 126,087, while short non-commercial positions fell by 2,483 to 54,681. Consequently, the gap between long and short positions narrowed by 430.
Indicator Signals:
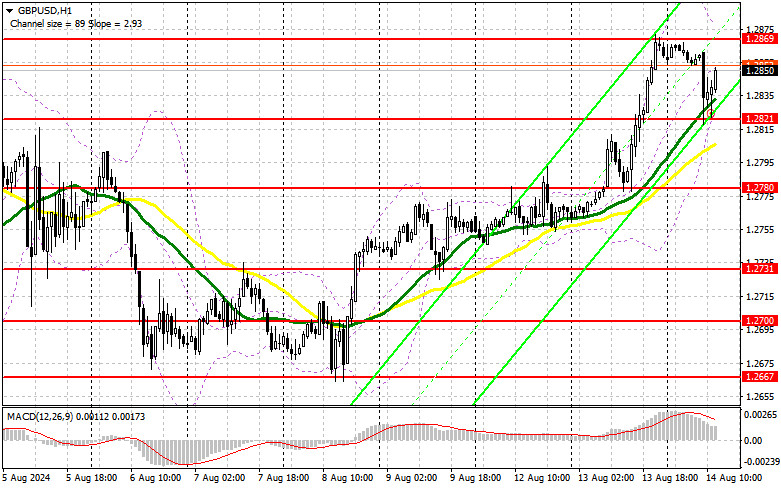
Moving Averages:
- Trading is above the 30-day and 50-day moving averages, suggesting potential further growth for the pound.
- Note: The periods and prices of the moving averages are based on the H1 hourly chart and differ from the classical daily moving averages on the D1 daily chart.
Bollinger Bands:
- In the event of a decline, the lower boundary of the indicator around 1.2835 will serve as support.
Indicator Descriptions:
- Moving Average (MA): Indicates the current trend by smoothing out volatility and noise. Period: 50. Marked in yellow on the chart.
- Moving Average (MA): Indicates the current trend by smoothing out volatility and noise. Period: 30. Marked in green on the chart.
- MACD Indicator (Moving Average Convergence/Divergence): Fast EMA period: 12. Slow EMA period: 26. SMA period: 9.
- Bollinger Bands: Period: 20.
- Non-commercial Traders: Speculators such as individual traders, hedge funds, and large institutions using the futures market for speculative purposes and meeting specific criteria.
- Long Non-commercial Positions: The total number of long positions held by non-commercial traders.
- Short Non-commercial Positions: The total number of short positions held by non-commercial traders.
- Total Non-commercial Net Position: The difference between the short and long positions held by non-commercial traders.


