empty
27.08.2024 01:33 PM
EUR/USD and GBP/USD: Technical Analysis for August 27

EUR/USD

This image is no longer relevant

Higher time frames

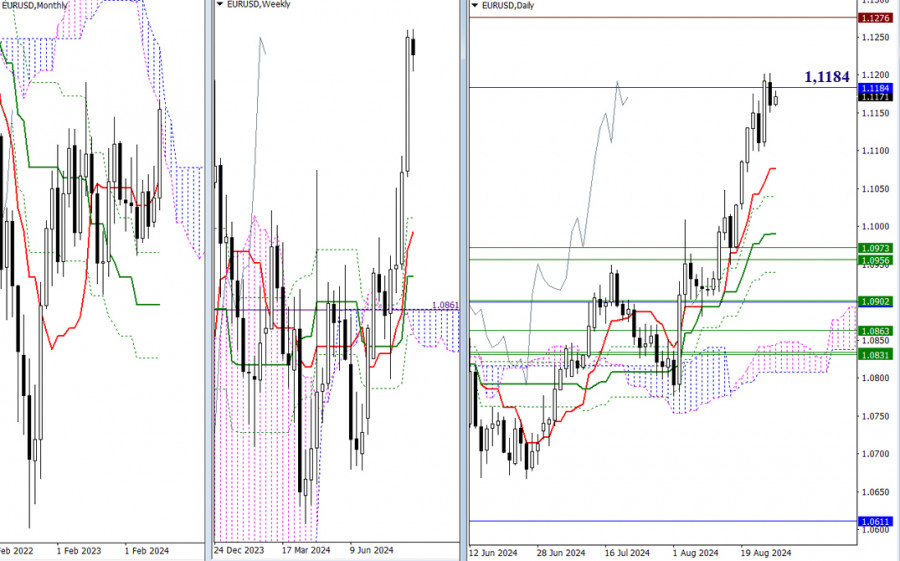
Interaction with the lower boundary of the monthly cloud (1.1184) continues. This interaction is already marked by a slowdown and a slight downward correction. This resistance is on the monthly time frame, so the daily result cannot be definitive. At the end of the week, we will close the week and the month, and the final outcome will be important. A breakout will open opportunities for testing and updating the high of 2023 (1.1276). A rebound will direct attention to support levels, with the first market encounter being the daily Ichimoku cross (1.1076 – 1.1040 – 1.0990 – 1.0940), reinforced by weekly levels (1.0973 – 1.0956).

This image is no longer relevant

H4 – H1

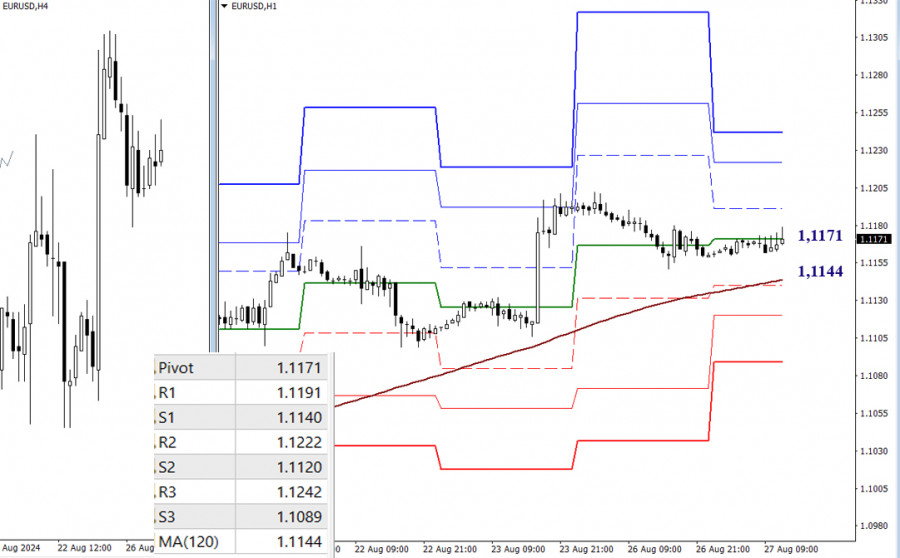
Currently, sideways movement persists on the lower time frames, with the central pivot level of the day (1.1171) as its center. Bullish traders continue to hold the upper hand. Testing and breaking the weekly long-term trend (1.1144) may affect the current balance of power, as a trend reversal and trading below this level will focus on further strengthening bearish sentiment. The next support will be the classic pivot levels (1.1120 – 1.1089). Maintaining the strength in favor of the bulls could stimulate bullish activity. For intraday bulls, the resistance levels of the classic pivots (1.1197 – 1.1222 – 1.1242) will be of interest.

***

GBP/USD

This image is no longer relevant

Higher time frames

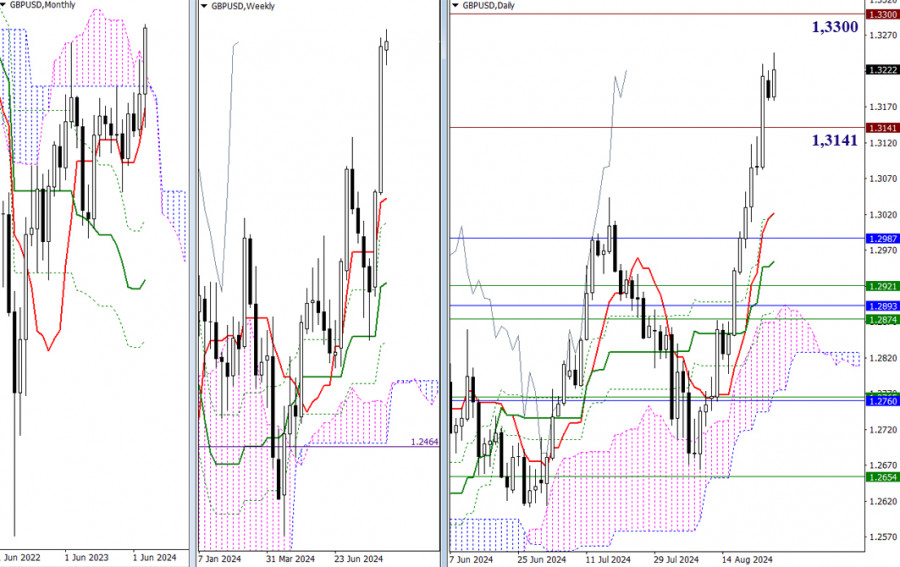
Yesterday, we observed a slowdown, but today, the pair has already updated last week's high and may continue to rise. Time will show whether bullish traders will be able to resume the uptrend. In the current situation, psychological levels 1.3300, 1.3400, and 1.3500 are key targets for the rise. If yesterday's slowdown develops further and the pause turns into a corrective decline, the previously reached high of 2023 (1.3141) could act as support, and then the market will encounter the daily short-term trend (1.3022).

This image is no longer relevant

H4 – H1

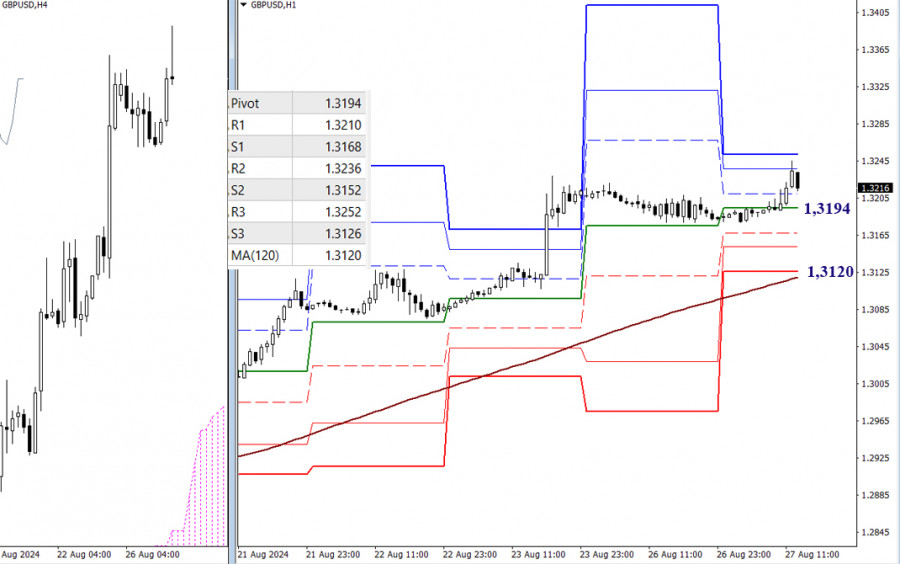
Bullish traders hold the main advantage in lower time frames. Today, the range of classic pivot levels is not very wide. The pair has almost surpassed it already, with only the R3 level (1.3252) remaining untouched. If the rise continues, attention will shift to the targets in the higher time frames. If a corrective decline occurs, the key levels on the lower time frames will be important, including the central pivot level of the day (1.3194) and the weekly long-term trend (1.3120). Intermediate support along the way can be noted at the S1 level (1.3168) and the S2 level (1.3152).

***

This technical analysis is based on the following ideas:

Larger time frames - Ichimoku Kinko Hyo (9.26.52) + Fibo Kijun levels

H1 – classic pivot points + 120-period Moving Average (weekly long-term trend)

Evangelos Poulakis,
Analytical expert of InstaForex
© 2007-2025
Summary
Urgency
Analytic
Zhizhko Nadezhda
Start trade
Earn on cryptocurrency rate changes with InstaForex
Download MetaTrader 4 and open your first trade
  • Grand Choice
    Contest by
    InstaForex
    InstaForex always strives to help you
    fulfill your biggest dreams.
    JOIN CONTEST

Recommended Stories

USD/JPY. Analysis, Forecast, and Current Market Situation

From a technical perspective, yesterday's strong rebound in USD/JPY from the 146.20 level stalled at the round figure of 148.00. Sustained gains above this level could lead to a move

Irina Yanina 13:55 2025-08-15 UTC+2

Forecast for EUR/USD on August 15, 2025

On Thursday, EUR/USD returned to the support zone at 1.1637–1.1645, but the bears failed to push further. A rebound from this zone would favor the euro and a resumption

Samir Klishi 12:37 2025-08-15 UTC+2

Forecast for GBP/USD on August 15, 2025

On the hourly chart, GBP/USD on Thursday rebounded from the 100.0% retracement level at 1.3586, turned in favor of the U.S. dollar, and saw a modest decline toward the 76.4%

Samir Klishi 12:31 2025-08-15 UTC+2

GBP/USD. Indicator Analysis on August 15, 2025

On Thursday, the pair moved downward, tested the 85.4% retracement level at 1.3522 (red dotted line), and closed the daily candle at 1.3526. Today, the pair may start moving upward

Stefan Doll 11:33 2025-08-15 UTC+2

EUR/USD. Indicator Analysis on August 15, 2025

On Thursday, the pair moved down, tested the 21-period EMA at 1.1632 (thin black line), and then moved upward, closing the daily candle at 1.1646. Today, the pair may begin

Stefan Doll 11:25 2025-08-15 UTC+2

Forex forecast 14/08/2025: EUR/USD, USD/JPY, GBP/USD, AUD/USD, Ethereum and Bitcoin

Useful links: My other articles are available in this section InstaForex course for beginners Popular Analytics Open trading account Important: The begginers in forex trading need to be very careful

Sebastian Seliga 09:07 2025-08-15 UTC+2

GBP/USD Forecast for August 15, 2025

Yesterday's U.S. producer inflation data for July showed a sharp jump: 0.9% for the month and 3.3% y/y versus 2.4% y/y the previous month. The probability of a September Federal

Laurie Bailey 05:01 2025-08-15 UTC+2

EUR/USD Forecast for August 15, 2025

The euro has now reached Fibonacci time line No. 8 — and it has arrived with a pessimistic mood. Yesterday, the support level at 1.1632 was tested, and the Marlin

Laurie Bailey 05:01 2025-08-15 UTC+2

AUD/USD Forecast for August 15, 2025

After yesterday's sharp drop of more than 50 pips, it has become clear that the breakout and consolidation above the balance line (blue rectangle) was false, which now shifts

Laurie Bailey 04:53 2025-08-15 UTC+2

EUR/USD – August 14th. Friday will be decisive

On Wednesday, the EUR/USD pair continued its upward movement and consolidated above the 76.4% retracement level at 1.1695. This suggests that the euro may continue rising today toward the next

Samir Klishi 11:57 2025-08-14 UTC+2
Can't speak right now?
Ask your question in the chat.
Widget callback